29
/
en
AIzaSyAYiBZKx7MnpbEhh9jyipgxe19OcubqV5w
April 1, 2024
235040
Saudi Arabia
SAU
true
2
1
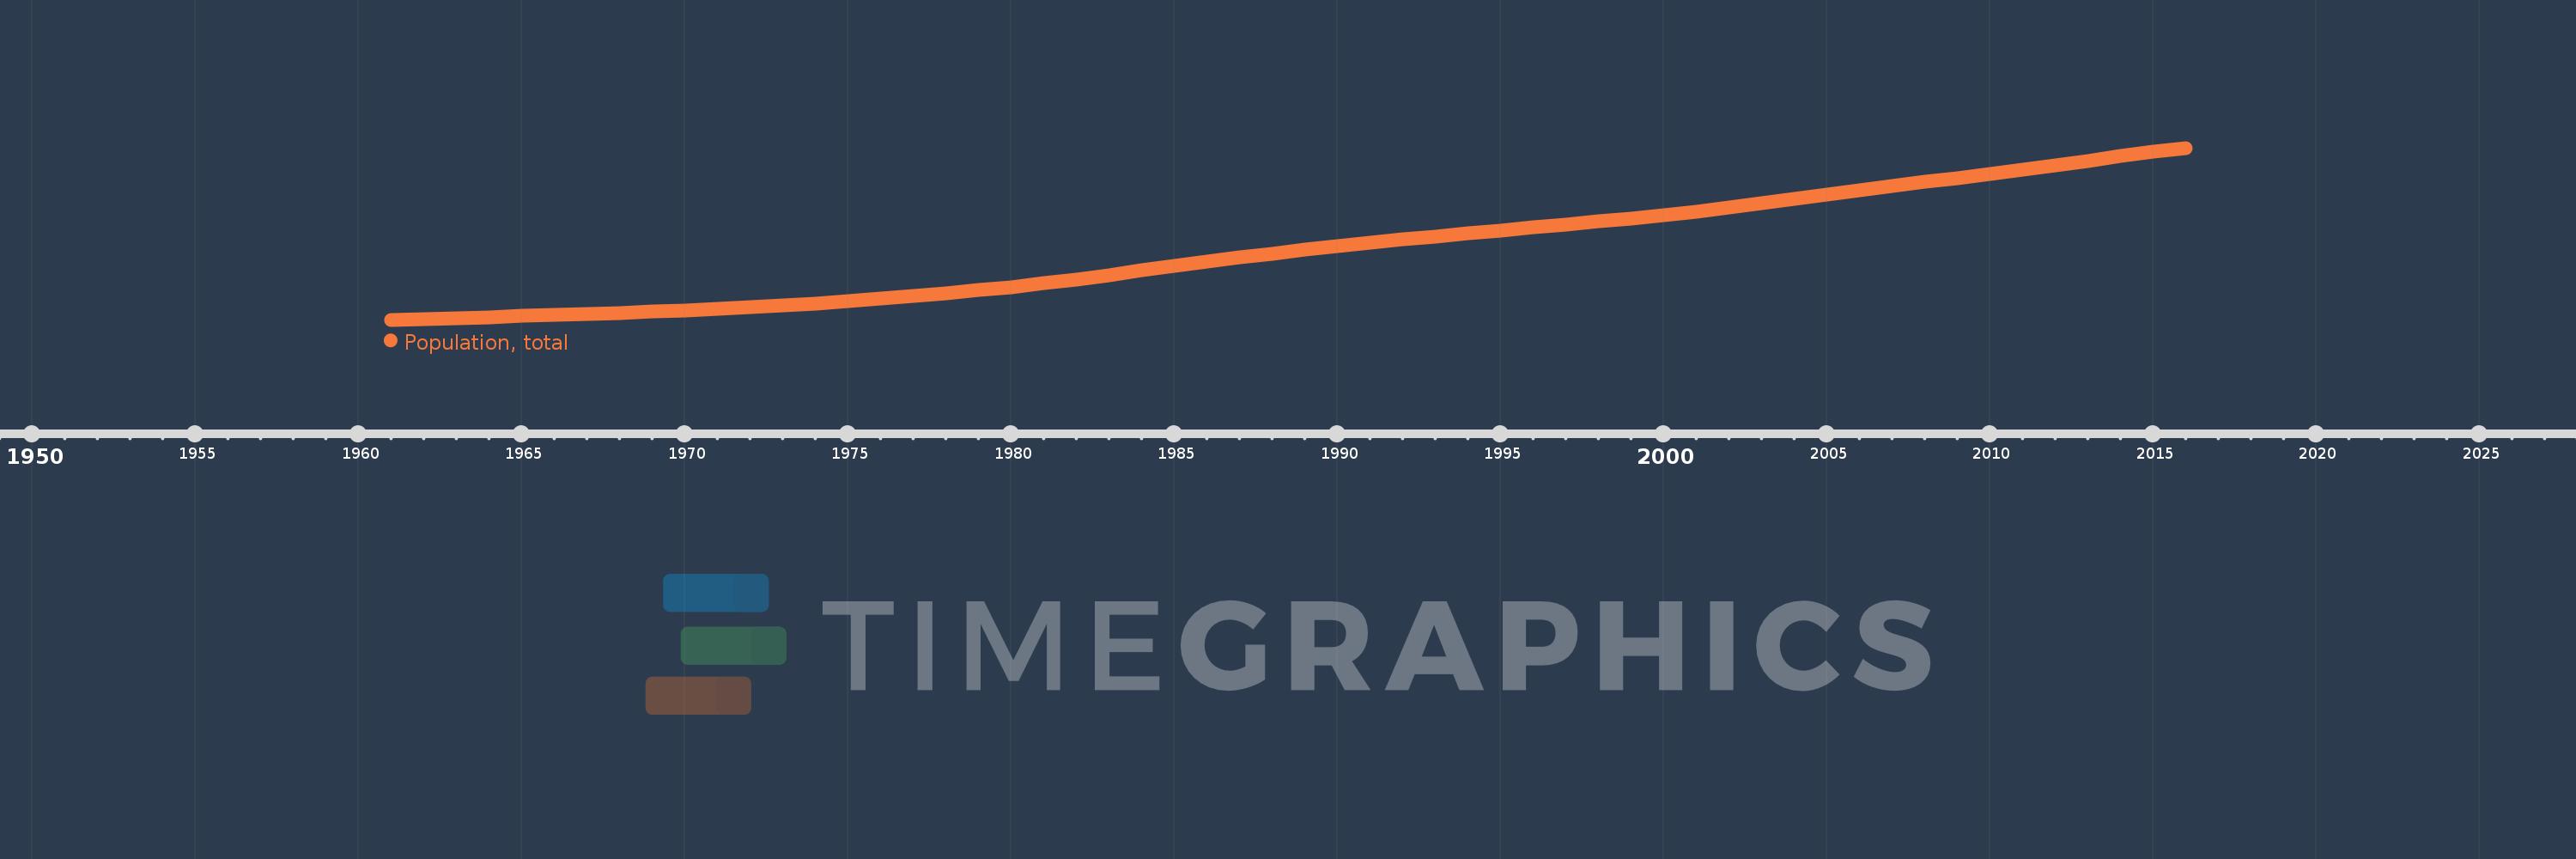
Population, total
2016,2015,2014,2013,2012,2011,2010,2009,2008,2007,2006,2005,2004,2003,2002,2001,2000,1999,1998,1997,1996,1995,1994,1993,1992,1991,1990,1989,1988,1987,1986,1985,1984,1983,1982,1981,1980,1979,1978,1977,1976,1975,1974,1973,1972,1971,1970,1969,1968,1967,1966,1965,1964,1963,1962,1961
This statistics in other country:
AfghanistanAlbaniaAlgeriaAmerican SamoaAndorraAngolaAntigua and BarbudaArab WorldArgentinaArmeniaArubaAustraliaAustriaAzerbaijanBahamas, TheBahrainBangladeshBarbadosBelarusBelgiumBelizeBeninBermudaBhutanBoliviaBosnia and HerzegovinaBotswanaBrazilBritish Virgin IslandsBrunei DarussalamBulgariaBurkina FasoBurundiCabo VerdeCambodiaCameroonCanadaCaribbean small statesCayman IslandsCentral African RepublicCentral Europe and the BalticsChadChannel IslandsChileChinaColombiaComorosCongo, Dem. Rep.Congo, Rep.Costa RicaCote d'IvoireCroatiaCubaCuracaoCyprusCzech RepublicDenmarkDjiboutiDominicaDominican RepublicEarly-demographic dividendEast Asia & PacificEast Asia & Pacific (excluding high income)East Asia & Pacific (IDA & IBRD countries)EcuadorEgypt, Arab Rep.El SalvadorEquatorial GuineaEritreaEstoniaEthiopiaEuro areaEurope & Central AsiaEurope & Central Asia (excluding high income)Europe & Central Asia (IDA & IBRD countries)European UnionFaroe IslandsFijiFinlandFragile and conflict affected situationsFranceFrench PolynesiaGabonGambia, TheGeorgiaGermanyGhanaGibraltarGreeceGreenlandGrenadaGuamGuatemalaGuineaGuinea-BissauGuyanaHaitiHeavily indebted poor countries (HIPC)High incomeHondurasHong Kong SAR, ChinaHungaryIBRD onlyIcelandIDA & IBRD totalIDA blendIDA onlyIDA totalIndiaIndonesiaIran, Islamic Rep.IraqIrelandIsle of ManIsraelItalyJamaicaJapanJordanKazakhstanKenyaKiribatiKorea, Dem. People’s Rep.Korea, Rep.KosovoKuwaitKyrgyz RepublicLao PDRLate-demographic dividendLatin America & Caribbean Latin America & Caribbean (excluding high income)Latin America & the Caribbean (IDA & IBRD countries)LatviaLeast developed countries: UN classificationLebanonLesothoLiberiaLibyaLiechtensteinLithuaniaLow & middle incomeLow incomeLower middle incomeLuxembourgMacao SAR, ChinaMacedonia, FYRMadagascarMalawiMalaysiaMaldivesMaliMaltaMarshall IslandsMauritaniaMauritiusMexicoMicronesia, Fed. Sts.Middle East & North AfricaMiddle East & North Africa (excluding high income)Middle East & North Africa (IDA & IBRD countries)Middle incomeMoldovaMonacoMongoliaMontenegroMoroccoMozambiqueMyanmarNamibiaNauruNepalNetherlandsNew CaledoniaNew ZealandNicaraguaNigerNigeriaNorth AmericaNorthern Mariana IslandsNorwayOECD membersOmanOther small statesPacific island small statesPakistanPalauPanamaPapua New GuineaParaguayPeruPhilippinesPolandPortugalPost-demographic dividendPre-demographic dividendPuerto RicoQatarRomaniaRussian FederationRwandaSamoaSan MarinoSao Tome and PrincipeSaudi ArabiaSenegalSerbiaSeychellesSierra LeoneSingaporeSint Maarten (Dutch part)Slovak RepublicSloveniaSmall statesSolomon IslandsSomaliaSouth AfricaSouth AsiaSouth Asia (IDA & IBRD)South SudanSpainSri LankaSt. Kitts and NevisSt. LuciaSt. Martin (French part)St. Vincent and the GrenadinesSub-Saharan Africa Sub-Saharan Africa (excluding high income)Sub-Saharan Africa (IDA & IBRD countries)SudanSurinameSwazilandSwedenSwitzerlandSyrian Arab RepublicTajikistanTanzaniaThailandTimor-LesteTogoTongaTrinidad and TobagoTunisiaTurkeyTurkmenistanTurks and Caicos IslandsTuvaluUgandaUkraineUnited Arab EmiratesUnited KingdomUnited StatesUpper middle incomeUruguayUzbekistanVanuatuVenezuela, RBVietnamVirgin Islands (U.S.)West Bank and GazaWorldYemen, Rep.ZambiaZimbabwe Timeline:
This timeline shows a graph from 1961 to 2016 of Saudi Arabia. No data until 1960. Number of actual observations by date: 56.
Source name:
World Development Indicators
Source organization:
(1) United Nations Population Division. World Population Prospects, (2) Census reports and other statistical publications from national statistical offices, (3) Eurostat: Demographic Statistics, (4) United Nations Statistical Division. Population and Vital Statistics Report (various years), (5) U.S. Census Bureau: International Database, and (6) Secretariat of the Pacific Community: Statistics and Demography Programme.
Categories, topics:
Climate Change, Health
Last updated:
apr 23, 2017
Indicators value changes by year
Minimum:
4.087 mln
jan 1, 1961
Maximum:
31.54 mln
jan 1, 2016
At the date of observation
Value
Absolute change
Change from previous value
jan 1, 1961
4.087 mln
+4.087 mln
0.0%
jan 1, 1962
4.219 mln
+132.34K
3.24%
jan 1, 1963
4.363 mln
+143.984K
3.41%
jan 1, 1964
4.517 mln
+153.8K
3.53%
jan 1, 1965
4.677 mln
+160.746K
3.56%
jan 1, 1966
4.844 mln
+166.226K
3.55%
jan 1, 1967
5.016 mln
+172.037K
3.55%
jan 1, 1968
5.196 mln
+180.677K
3.6%
jan 1, 1969
5.39 mln
+193.499K
3.72%
jan 1, 1970
5.602 mln
+211.801K
3.93%
jan 1, 1971
5.836 mln
+234.745K
4.19%
jan 1, 1972
6.096 mln
+259.712K
4.45%
jan 1, 1973
6.382 mln
+286.0K
4.69%
jan 1, 1974
6.697 mln
+315.38K
4.94%
jan 1, 1975
7.045 mln
+347.991K
5.2%
jan 1, 1976
7.429 mln
+383.228K
5.44%
jan 1, 1977
7.845 mln
+416.595K
5.61%
jan 1, 1978
8.295 mln
+450.084K
5.74%
jan 1, 1979
8.785 mln
+489.942K
5.91%
jan 1, 1980
9.323 mln
+537.964K
6.12%
jan 1, 1981
9.913 mln
+589.627K
6.32%
jan 1, 1982
10.557 mln
+644.019K
6.5%
jan 1, 1983
11.247 mln
+690.149K
6.54%
jan 1, 1984
11.962 mln
+715.159K
6.36%
jan 1, 1985
12.674 mln
+711.845K
5.95%
jan 1, 1986
13.361 mln
+687.195K
5.42%
jan 1, 1987
14.017 mln
+655.285K
4.9%
jan 1, 1988
14.642 mln
+625.785K
4.46%
jan 1, 1989
15.239 mln
+596.82K
4.08%
jan 1, 1990
15.811 mln
+571.806K
3.75%
jan 1, 1991
16.361 mln
+550.473K
3.48%
jan 1, 1992
16.891 mln
+529.102K
3.23%
jan 1, 1993
17.399 mln
+507.968K
3.01%
jan 1, 1994
17.891 mln
+492.006K
2.83%
jan 1, 1995
18.373 mln
+482.883K
2.7%
jan 1, 1996
18.854 mln
+480.258K
2.61%
jan 1, 1997
19.331 mln
+477.641K
2.53%
jan 1, 1998
19.81 mln
+478.322K
2.47%
jan 1, 1999
20.302 mln
+492.56K
2.49%
jan 1, 2000
20.826 mln
+523.762K
2.58%
jan 1, 2001
21.392 mln
+566.318K
2.72%
jan 1, 2002
22.008 mln
+615.664K
2.88%
jan 1, 2003
22.668 mln
+660.165K
3.0%
jan 1, 2004
23.358 mln
+689.785K
3.04%
jan 1, 2005
24.056 mln
+697.686K
2.99%
jan 1, 2006
24.745 mln
+689.657K
2.87%
jan 1, 2007
25.42 mln
+674.764K
2.73%
jan 1, 2008
26.084 mln
+663.528K
2.61%
jan 1, 2009
26.743 mln
+659.32K
2.53%
jan 1, 2010
27.409 mln
+666.649K
2.49%
jan 1, 2011
28.091 mln
+681.156K
2.49%
jan 1, 2012
28.788 mln
+697.791K
2.48%
jan 1, 2013
29.496 mln
+707.609K
2.46%
jan 1, 2014
30.201 mln
+705.004K
2.39%
jan 1, 2015
30.887 mln
+685.494K
2.27%
jan 1, 2016
31.54 mln
+653.827K
2.12%
Ranking of countries by current statistics by years


Comments: