29
/
en
AIzaSyAYiBZKx7MnpbEhh9jyipgxe19OcubqV5w
April 1, 2024
40255
IDA total
IDA
false
2
1
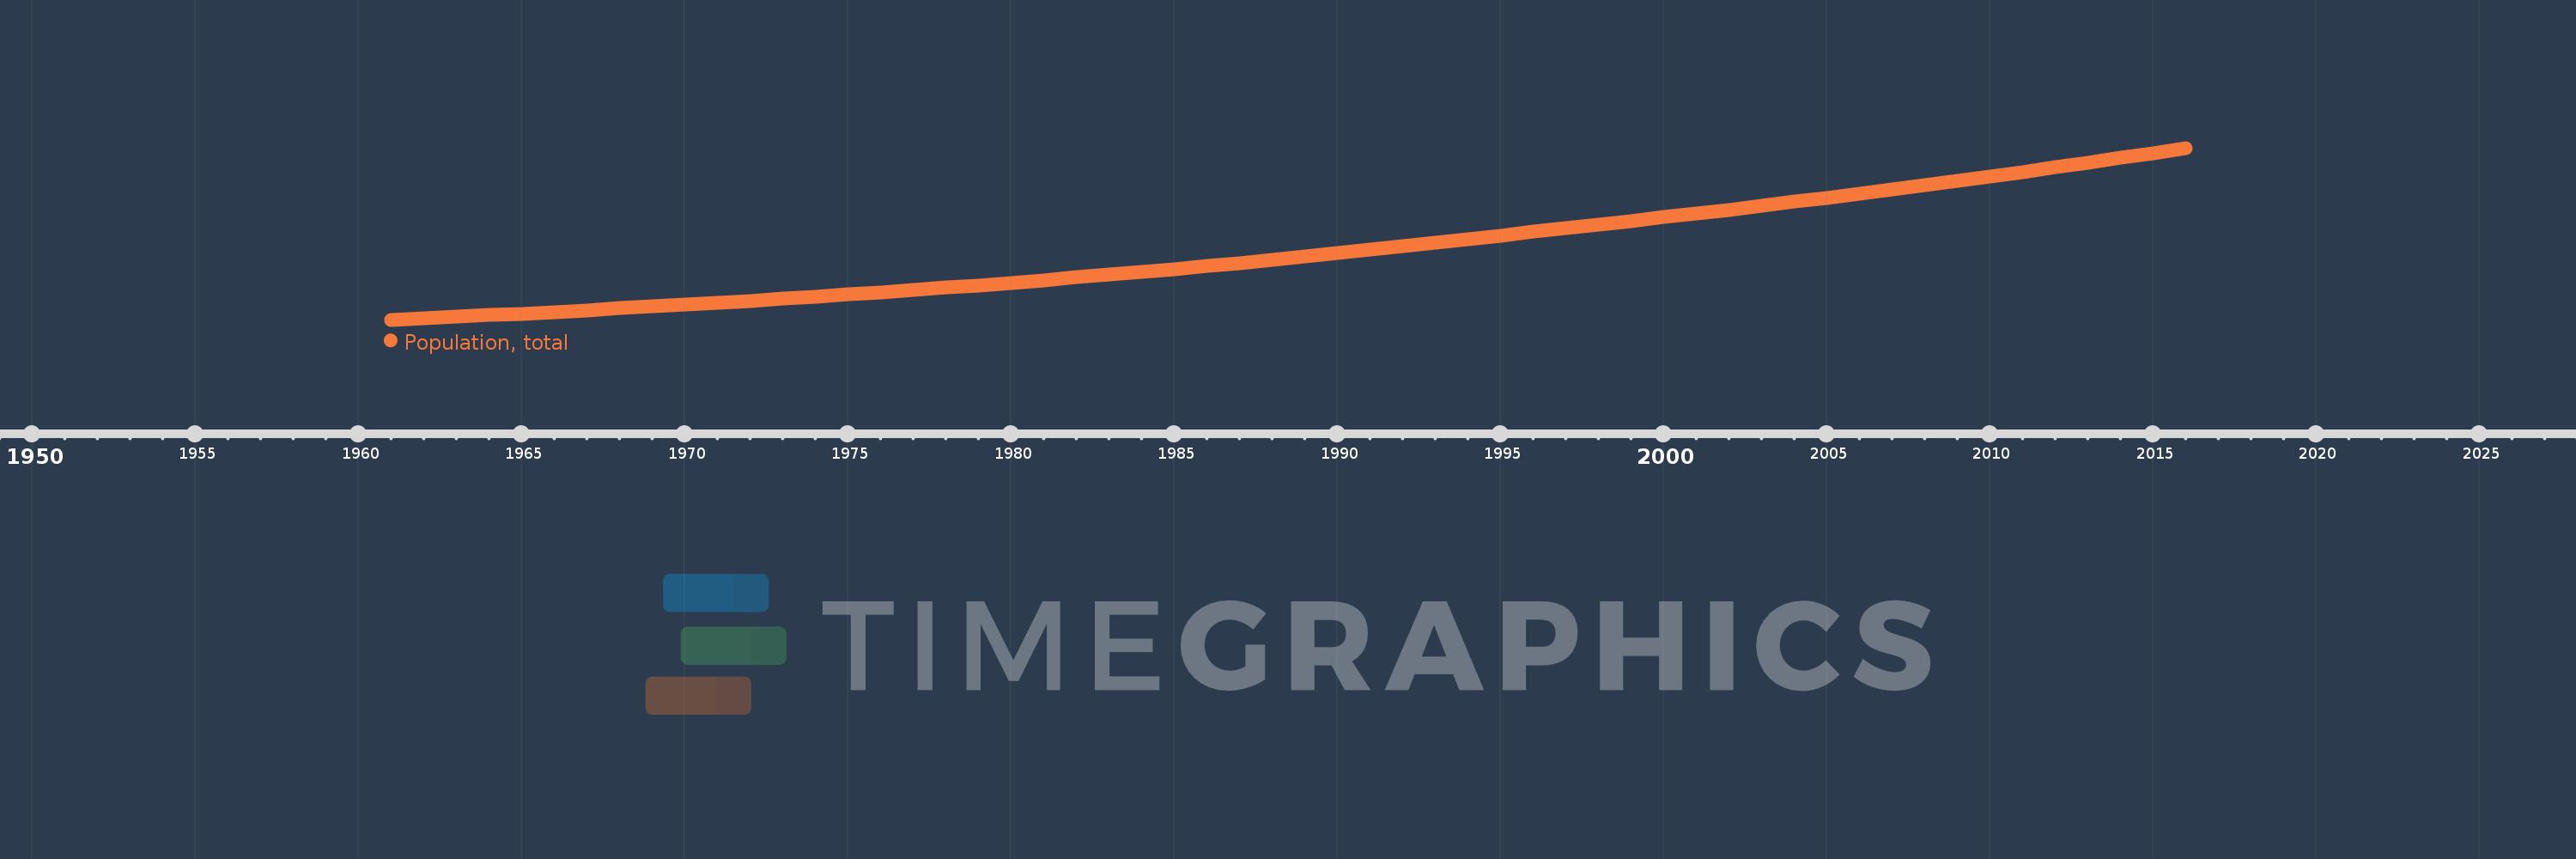
Population, total
2016,2015,2014,2013,2012,2011,2010,2009,2008,2007,2006,2005,2004,2003,2002,2001,2000,1999,1998,1997,1996,1995,1994,1993,1992,1991,1990,1989,1988,1987,1986,1985,1984,1983,1982,1981,1980,1979,1978,1977,1976,1975,1974,1973,1972,1971,1970,1969,1968,1967,1966,1965,1964,1963,1962,1961
This statistics in other country:
AfghanistanAlbaniaAlgeriaAmerican SamoaAndorraAngolaAntigua and BarbudaArab WorldArgentinaArmeniaArubaAustraliaAustriaAzerbaijanBahamas, TheBahrainBangladeshBarbadosBelarusBelgiumBelizeBeninBermudaBhutanBoliviaBosnia and HerzegovinaBotswanaBrazilBritish Virgin IslandsBrunei DarussalamBulgariaBurkina FasoBurundiCabo VerdeCambodiaCameroonCanadaCaribbean small statesCayman IslandsCentral African RepublicCentral Europe and the BalticsChadChannel IslandsChileChinaColombiaComorosCongo, Dem. Rep.Congo, Rep.Costa RicaCote d'IvoireCroatiaCubaCuracaoCyprusCzech RepublicDenmarkDjiboutiDominicaDominican RepublicEarly-demographic dividendEast Asia & PacificEast Asia & Pacific (excluding high income)East Asia & Pacific (IDA & IBRD countries)EcuadorEgypt, Arab Rep.El SalvadorEquatorial GuineaEritreaEstoniaEthiopiaEuro areaEurope & Central AsiaEurope & Central Asia (excluding high income)Europe & Central Asia (IDA & IBRD countries)European UnionFaroe IslandsFijiFinlandFragile and conflict affected situationsFranceFrench PolynesiaGabonGambia, TheGeorgiaGermanyGhanaGibraltarGreeceGreenlandGrenadaGuamGuatemalaGuineaGuinea-BissauGuyanaHaitiHeavily indebted poor countries (HIPC)High incomeHondurasHong Kong SAR, ChinaHungaryIBRD onlyIcelandIDA & IBRD totalIDA blendIDA onlyIDA totalIndiaIndonesiaIran, Islamic Rep.IraqIrelandIsle of ManIsraelItalyJamaicaJapanJordanKazakhstanKenyaKiribatiKorea, Dem. People’s Rep.Korea, Rep.KosovoKuwaitKyrgyz RepublicLao PDRLate-demographic dividendLatin America & Caribbean Latin America & Caribbean (excluding high income)Latin America & the Caribbean (IDA & IBRD countries)LatviaLeast developed countries: UN classificationLebanonLesothoLiberiaLibyaLiechtensteinLithuaniaLow & middle incomeLow incomeLower middle incomeLuxembourgMacao SAR, ChinaMacedonia, FYRMadagascarMalawiMalaysiaMaldivesMaliMaltaMarshall IslandsMauritaniaMauritiusMexicoMicronesia, Fed. Sts.Middle East & North AfricaMiddle East & North Africa (excluding high income)Middle East & North Africa (IDA & IBRD countries)Middle incomeMoldovaMonacoMongoliaMontenegroMoroccoMozambiqueMyanmarNamibiaNauruNepalNetherlandsNew CaledoniaNew ZealandNicaraguaNigerNigeriaNorth AmericaNorthern Mariana IslandsNorwayOECD membersOmanOther small statesPacific island small statesPakistanPalauPanamaPapua New GuineaParaguayPeruPhilippinesPolandPortugalPost-demographic dividendPre-demographic dividendPuerto RicoQatarRomaniaRussian FederationRwandaSamoaSan MarinoSao Tome and PrincipeSaudi ArabiaSenegalSerbiaSeychellesSierra LeoneSingaporeSint Maarten (Dutch part)Slovak RepublicSloveniaSmall statesSolomon IslandsSomaliaSouth AfricaSouth AsiaSouth Asia (IDA & IBRD)South SudanSpainSri LankaSt. Kitts and NevisSt. LuciaSt. Martin (French part)St. Vincent and the GrenadinesSub-Saharan Africa Sub-Saharan Africa (excluding high income)Sub-Saharan Africa (IDA & IBRD countries)SudanSurinameSwazilandSwedenSwitzerlandSyrian Arab RepublicTajikistanTanzaniaThailandTimor-LesteTogoTongaTrinidad and TobagoTunisiaTurkeyTurkmenistanTurks and Caicos IslandsTuvaluUgandaUkraineUnited Arab EmiratesUnited KingdomUnited StatesUpper middle incomeUruguayUzbekistanVanuatuVenezuela, RBVietnamVirgin Islands (U.S.)West Bank and GazaWorldYemen, Rep.ZambiaZimbabwe Timeline:
This timeline shows a graph from 1961 to 2016 of IDA total. No data until 1960. Number of actual observations by date: 56.
Source name:
World Development Indicators
Source organization:
(1) United Nations Population Division. World Population Prospects, (2) Census reports and other statistical publications from national statistical offices, (3) Eurostat: Demographic Statistics, (4) United Nations Statistical Division. Population and Vital Statistics Report (various years), (5) U.S. Census Bureau: International Database, and (6) Secretariat of the Pacific Community: Statistics and Demography Programme.
Categories, topics:
Climate Change, Health
Last updated:
apr 23, 2017
Indicators value changes by year
Minimum:
431.581 mln
jan 1, 1961
Maximum:
1.66 bln
jan 1, 2016
At the date of observation
Value
Absolute change
Change from previous value
jan 1, 1961
431.581 mln
+431.581 mln
0.0%
jan 1, 1962
441.905 mln
+10.324 mln
2.39%
jan 1, 1963
452.617 mln
+10.712 mln
2.42%
jan 1, 1964
463.606 mln
+10.989 mln
2.43%
jan 1, 1965
475.221 mln
+11.615 mln
2.51%
jan 1, 1966
487.234 mln
+12.013 mln
2.53%
jan 1, 1967
499.759 mln
+12.525 mln
2.57%
jan 1, 1968
512.754 mln
+12.995 mln
2.6%
jan 1, 1969
526.17 mln
+13.416 mln
2.62%
jan 1, 1970
539.837 mln
+13.667 mln
2.6%
jan 1, 1971
553.705 mln
+13.868 mln
2.57%
jan 1, 1972
567.662 mln
+13.957 mln
2.52%
jan 1, 1973
581.846 mln
+14.183 mln
2.5%
jan 1, 1974
596.43 mln
+14.584 mln
2.51%
jan 1, 1975
611.486 mln
+15.056 mln
2.52%
jan 1, 1976
627.178 mln
+15.692 mln
2.57%
jan 1, 1977
643.543 mln
+16.365 mln
2.61%
jan 1, 1978
660.544 mln
+17.0 mln
2.64%
jan 1, 1979
678.165 mln
+17.621 mln
2.67%
jan 1, 1980
696.354 mln
+18.19 mln
2.68%
jan 1, 1981
715.021 mln
+18.666 mln
2.68%
jan 1, 1982
733.901 mln
+18.88 mln
2.64%
jan 1, 1983
753.39 mln
+19.49 mln
2.66%
jan 1, 1984
773.426 mln
+20.036 mln
2.66%
jan 1, 1985
794.114 mln
+20.688 mln
2.67%
jan 1, 1986
815.548 mln
+21.434 mln
2.7%
jan 1, 1987
837.792 mln
+22.244 mln
2.73%
jan 1, 1988
860.74 mln
+22.948 mln
2.74%
jan 1, 1989
884.257 mln
+23.517 mln
2.73%
jan 1, 1990
908.32 mln
+24.063 mln
2.72%
jan 1, 1991
932.602 mln
+24.282 mln
2.67%
jan 1, 1992
957.37 mln
+24.768 mln
2.66%
jan 1, 1993
982.642 mln
+25.272 mln
2.64%
jan 1, 1994
1.008 bln
+25.581 mln
2.6%
jan 1, 1995
1.034 bln
+25.732 mln
2.55%
jan 1, 1996
1.06 bln
+25.881 mln
2.5%
jan 1, 1997
1.086 bln
+26.022 mln
2.46%
jan 1, 1998
1.112 bln
+26.131 mln
2.41%
jan 1, 1999
1.138 bln
+26.167 mln
2.35%
jan 1, 2000
1.164 bln
+26.297 mln
2.31%
jan 1, 2001
1.191 bln
+26.845 mln
2.31%
jan 1, 2002
1.219 bln
+27.307 mln
2.29%
jan 1, 2003
1.246 bln
+27.682 mln
2.27%
jan 1, 2004
1.274 bln
+28.178 mln
2.26%
jan 1, 2005
1.303 bln
+28.741 mln
2.26%
jan 1, 2006
1.332 bln
+29.259 mln
2.25%
jan 1, 2007
1.362 bln
+29.826 mln
2.24%
jan 1, 2008
1.393 bln
+30.462 mln
2.24%
jan 1, 2009
1.424 bln
+31.091 mln
2.23%
jan 1, 2010
1.456 bln
+31.694 mln
2.23%
jan 1, 2011
1.488 bln
+32.594 mln
2.24%
jan 1, 2012
1.521 bln
+33.184 mln
2.23%
jan 1, 2013
1.555 bln
+33.43 mln
2.2%
jan 1, 2014
1.589 bln
+34.122 mln
2.19%
jan 1, 2015
1.624 bln
+34.936 mln
2.2%
jan 1, 2016
1.66 bln
+35.752 mln
2.2%
Ranking of countries by current statistics by years


Comments: