29
/
en
AIzaSyAYiBZKx7MnpbEhh9jyipgxe19OcubqV5w
April 1, 2024
155124
India
IND
true
2
1
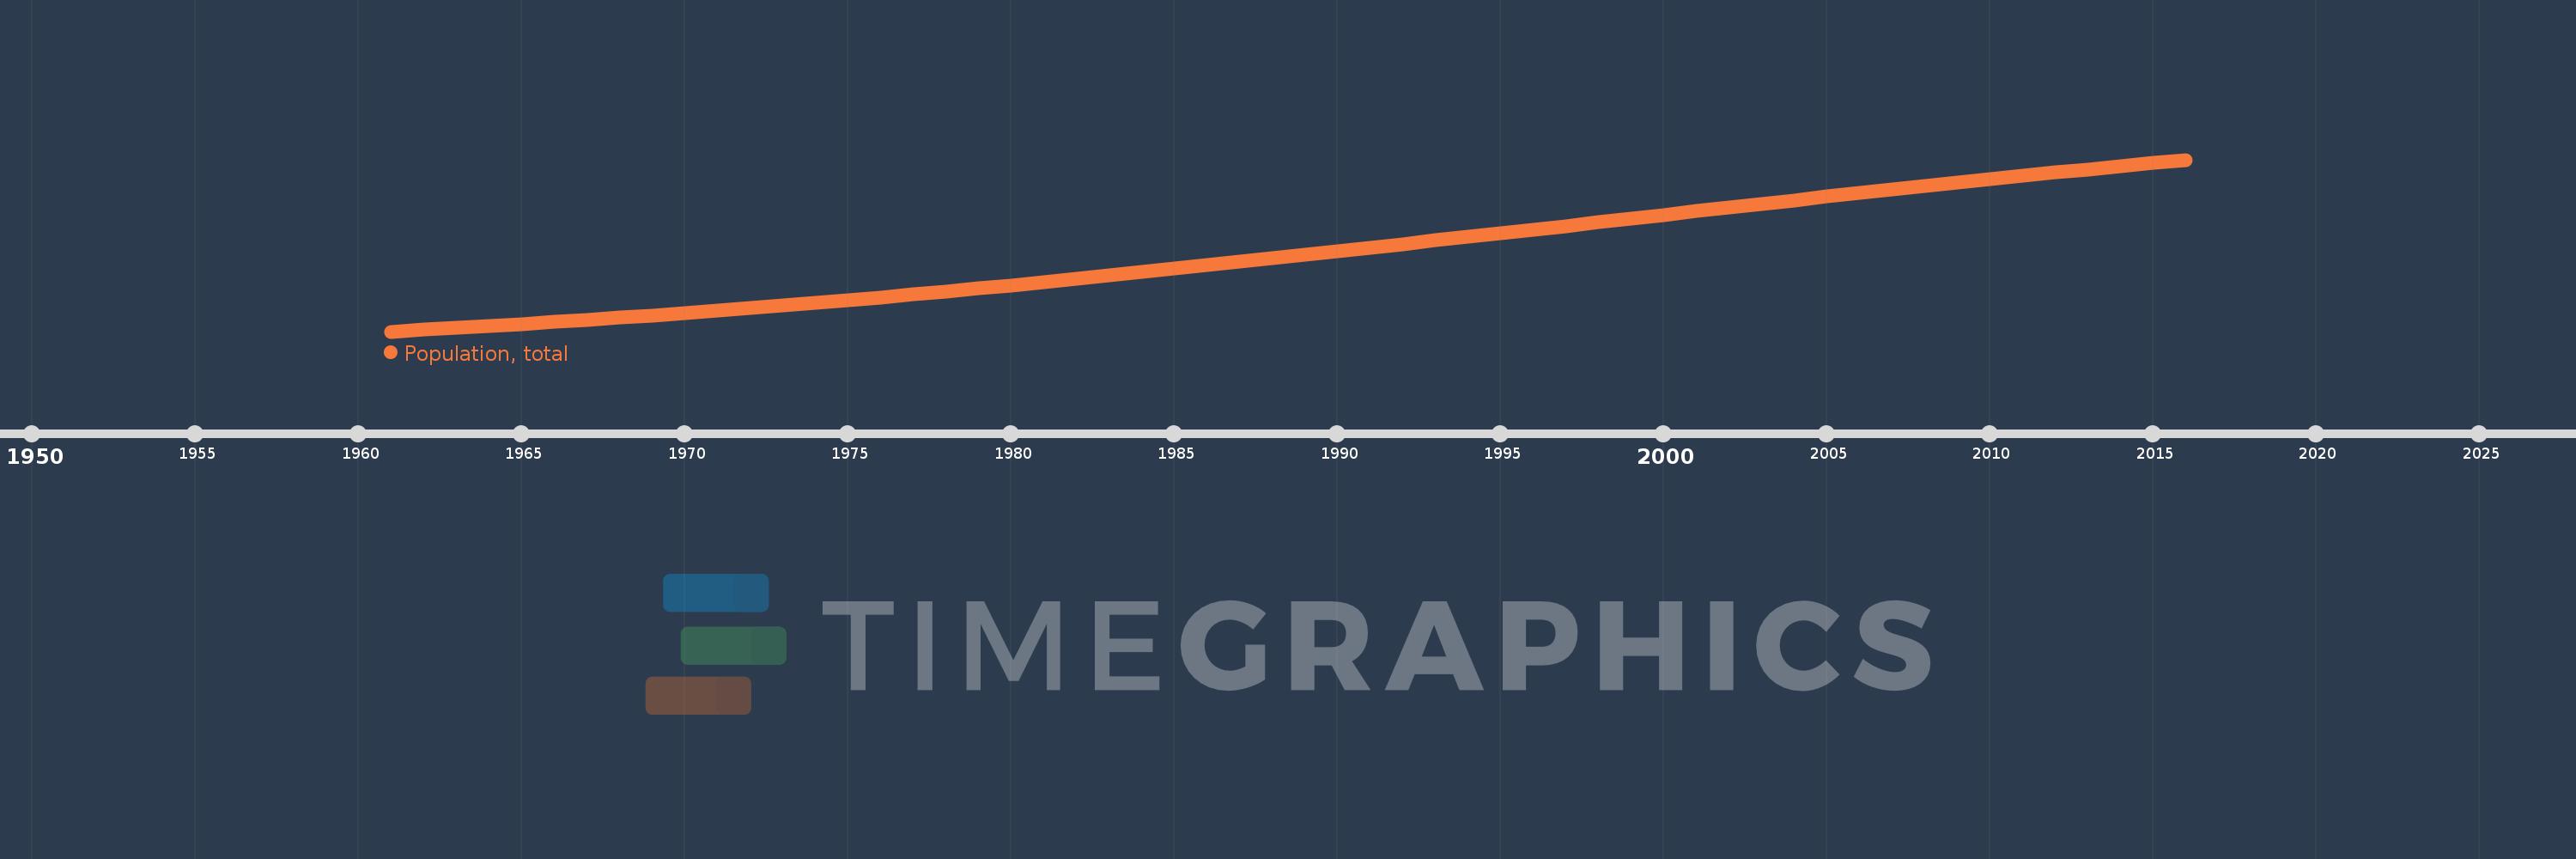
Population, total
2016,2015,2014,2013,2012,2011,2010,2009,2008,2007,2006,2005,2004,2003,2002,2001,2000,1999,1998,1997,1996,1995,1994,1993,1992,1991,1990,1989,1988,1987,1986,1985,1984,1983,1982,1981,1980,1979,1978,1977,1976,1975,1974,1973,1972,1971,1970,1969,1968,1967,1966,1965,1964,1963,1962,1961
This statistics in other country:
AfghanistanAlbaniaAlgeriaAmerican SamoaAndorraAngolaAntigua and BarbudaArab WorldArgentinaArmeniaArubaAustraliaAustriaAzerbaijanBahamas, TheBahrainBangladeshBarbadosBelarusBelgiumBelizeBeninBermudaBhutanBoliviaBosnia and HerzegovinaBotswanaBrazilBritish Virgin IslandsBrunei DarussalamBulgariaBurkina FasoBurundiCabo VerdeCambodiaCameroonCanadaCaribbean small statesCayman IslandsCentral African RepublicCentral Europe and the BalticsChadChannel IslandsChileChinaColombiaComorosCongo, Dem. Rep.Congo, Rep.Costa RicaCote d'IvoireCroatiaCubaCuracaoCyprusCzech RepublicDenmarkDjiboutiDominicaDominican RepublicEarly-demographic dividendEast Asia & PacificEast Asia & Pacific (excluding high income)East Asia & Pacific (IDA & IBRD countries)EcuadorEgypt, Arab Rep.El SalvadorEquatorial GuineaEritreaEstoniaEthiopiaEuro areaEurope & Central AsiaEurope & Central Asia (excluding high income)Europe & Central Asia (IDA & IBRD countries)European UnionFaroe IslandsFijiFinlandFragile and conflict affected situationsFranceFrench PolynesiaGabonGambia, TheGeorgiaGermanyGhanaGibraltarGreeceGreenlandGrenadaGuamGuatemalaGuineaGuinea-BissauGuyanaHaitiHeavily indebted poor countries (HIPC)High incomeHondurasHong Kong SAR, ChinaHungaryIBRD onlyIcelandIDA & IBRD totalIDA blendIDA onlyIDA totalIndiaIndonesiaIran, Islamic Rep.IraqIrelandIsle of ManIsraelItalyJamaicaJapanJordanKazakhstanKenyaKiribatiKorea, Dem. People’s Rep.Korea, Rep.KosovoKuwaitKyrgyz RepublicLao PDRLate-demographic dividendLatin America & Caribbean Latin America & Caribbean (excluding high income)Latin America & the Caribbean (IDA & IBRD countries)LatviaLeast developed countries: UN classificationLebanonLesothoLiberiaLibyaLiechtensteinLithuaniaLow & middle incomeLow incomeLower middle incomeLuxembourgMacao SAR, ChinaMacedonia, FYRMadagascarMalawiMalaysiaMaldivesMaliMaltaMarshall IslandsMauritaniaMauritiusMexicoMicronesia, Fed. Sts.Middle East & North AfricaMiddle East & North Africa (excluding high income)Middle East & North Africa (IDA & IBRD countries)Middle incomeMoldovaMonacoMongoliaMontenegroMoroccoMozambiqueMyanmarNamibiaNauruNepalNetherlandsNew CaledoniaNew ZealandNicaraguaNigerNigeriaNorth AmericaNorthern Mariana IslandsNorwayOECD membersOmanOther small statesPacific island small statesPakistanPalauPanamaPapua New GuineaParaguayPeruPhilippinesPolandPortugalPost-demographic dividendPre-demographic dividendPuerto RicoQatarRomaniaRussian FederationRwandaSamoaSan MarinoSao Tome and PrincipeSaudi ArabiaSenegalSerbiaSeychellesSierra LeoneSingaporeSint Maarten (Dutch part)Slovak RepublicSloveniaSmall statesSolomon IslandsSomaliaSouth AfricaSouth AsiaSouth Asia (IDA & IBRD)South SudanSpainSri LankaSt. Kitts and NevisSt. LuciaSt. Martin (French part)St. Vincent and the GrenadinesSub-Saharan Africa Sub-Saharan Africa (excluding high income)Sub-Saharan Africa (IDA & IBRD countries)SudanSurinameSwazilandSwedenSwitzerlandSyrian Arab RepublicTajikistanTanzaniaThailandTimor-LesteTogoTongaTrinidad and TobagoTunisiaTurkeyTurkmenistanTurks and Caicos IslandsTuvaluUgandaUkraineUnited Arab EmiratesUnited KingdomUnited StatesUpper middle incomeUruguayUzbekistanVanuatuVenezuela, RBVietnamVirgin Islands (U.S.)West Bank and GazaWorldYemen, Rep.ZambiaZimbabwe Timeline:
This timeline shows a graph from 1961 to 2016 of India. No data until 1960. Number of actual observations by date: 56.
Source name:
World Development Indicators
Source organization:
(1) United Nations Population Division. World Population Prospects, (2) Census reports and other statistical publications from national statistical offices, (3) Eurostat: Demographic Statistics, (4) United Nations Statistical Division. Population and Vital Statistics Report (various years), (5) U.S. Census Bureau: International Database, and (6) Secretariat of the Pacific Community: Statistics and Demography Programme.
Categories, topics:
Climate Change, Health
Last updated:
apr 23, 2017
Indicators value changes by year
Minimum:
449.662 mln
jan 1, 1961
Maximum:
1.311 bln
jan 1, 2016
At the date of observation
Value
Absolute change
Change from previous value
jan 1, 1961
449.662 mln
+449.662 mln
0.0%
jan 1, 1962
458.691 mln
+9.03 mln
2.01%
jan 1, 1963
468.054 mln
+9.363 mln
2.04%
jan 1, 1964
477.73 mln
+9.676 mln
2.07%
jan 1, 1965
487.69 mln
+9.96 mln
2.08%
jan 1, 1966
497.92 mln
+10.23 mln
2.1%
jan 1, 1967
508.403 mln
+10.483 mln
2.11%
jan 1, 1968
519.162 mln
+10.759 mln
2.12%
jan 1, 1969
530.275 mln
+11.113 mln
2.14%
jan 1, 1970
541.845 mln
+11.57 mln
2.18%
jan 1, 1971
553.943 mln
+12.098 mln
2.23%
jan 1, 1972
566.605 mln
+12.662 mln
2.29%
jan 1, 1973
579.801 mln
+13.195 mln
2.33%
jan 1, 1974
593.452 mln
+13.651 mln
2.35%
jan 1, 1975
607.447 mln
+13.995 mln
2.36%
jan 1, 1976
621.704 mln
+14.257 mln
2.35%
jan 1, 1977
636.183 mln
+14.479 mln
2.33%
jan 1, 1978
650.908 mln
+14.725 mln
2.31%
jan 1, 1979
665.936 mln
+15.029 mln
2.31%
jan 1, 1980
681.359 mln
+15.422 mln
2.32%
jan 1, 1981
697.23 mln
+15.871 mln
2.33%
jan 1, 1982
713.561 mln
+16.332 mln
2.34%
jan 1, 1983
730.303 mln
+16.742 mln
2.35%
jan 1, 1984
747.375 mln
+17.071 mln
2.34%
jan 1, 1985
764.664 mln
+17.289 mln
2.31%
jan 1, 1986
782.085 mln
+17.421 mln
2.28%
jan 1, 1987
799.607 mln
+17.522 mln
2.24%
jan 1, 1988
817.232 mln
+17.625 mln
2.2%
jan 1, 1989
834.944 mln
+17.712 mln
2.17%
jan 1, 1990
852.736 mln
+17.792 mln
2.13%
jan 1, 1991
870.602 mln
+17.866 mln
2.1%
jan 1, 1992
888.514 mln
+17.912 mln
2.06%
jan 1, 1993
906.461 mln
+17.947 mln
2.02%
jan 1, 1994
924.476 mln
+18.014 mln
1.99%
jan 1, 1995
942.604 mln
+18.129 mln
1.96%
jan 1, 1996
960.875 mln
+18.271 mln
1.94%
jan 1, 1997
979.29 mln
+18.415 mln
1.92%
jan 1, 1998
997.817 mln
+18.527 mln
1.89%
jan 1, 1999
1.016 bln
+18.586 mln
1.86%
jan 1, 2000
1.035 bln
+18.574 mln
1.83%
jan 1, 2001
1.053 bln
+18.504 mln
1.79%
jan 1, 2002
1.072 bln
+18.407 mln
1.75%
jan 1, 2003
1.09 bln
+18.301 mln
1.71%
jan 1, 2004
1.108 bln
+18.18 mln
1.67%
jan 1, 2005
1.126 bln
+18.05 mln
1.63%
jan 1, 2006
1.144 bln
+17.907 mln
1.59%
jan 1, 2007
1.162 bln
+17.762 mln
1.55%
jan 1, 2008
1.18 bln
+17.597 mln
1.51%
jan 1, 2009
1.197 bln
+17.384 mln
1.47%
jan 1, 2010
1.214 bln
+17.112 mln
1.43%
jan 1, 2011
1.231 bln
+16.802 mln
1.38%
jan 1, 2012
1.247 bln
+16.462 mln
1.34%
jan 1, 2013
1.264 bln
+16.144 mln
1.29%
jan 1, 2014
1.279 bln
+15.909 mln
1.26%
jan 1, 2015
1.295 bln
+15.793 mln
1.23%
jan 1, 2016
1.311 bln
+15.759 mln
1.22%
Ranking of countries by current statistics by years


Comments: