29
/
en
AIzaSyAYiBZKx7MnpbEhh9jyipgxe19OcubqV5w
April 1, 2024
213935
Northern Mariana Islands
MNP
true
2
1
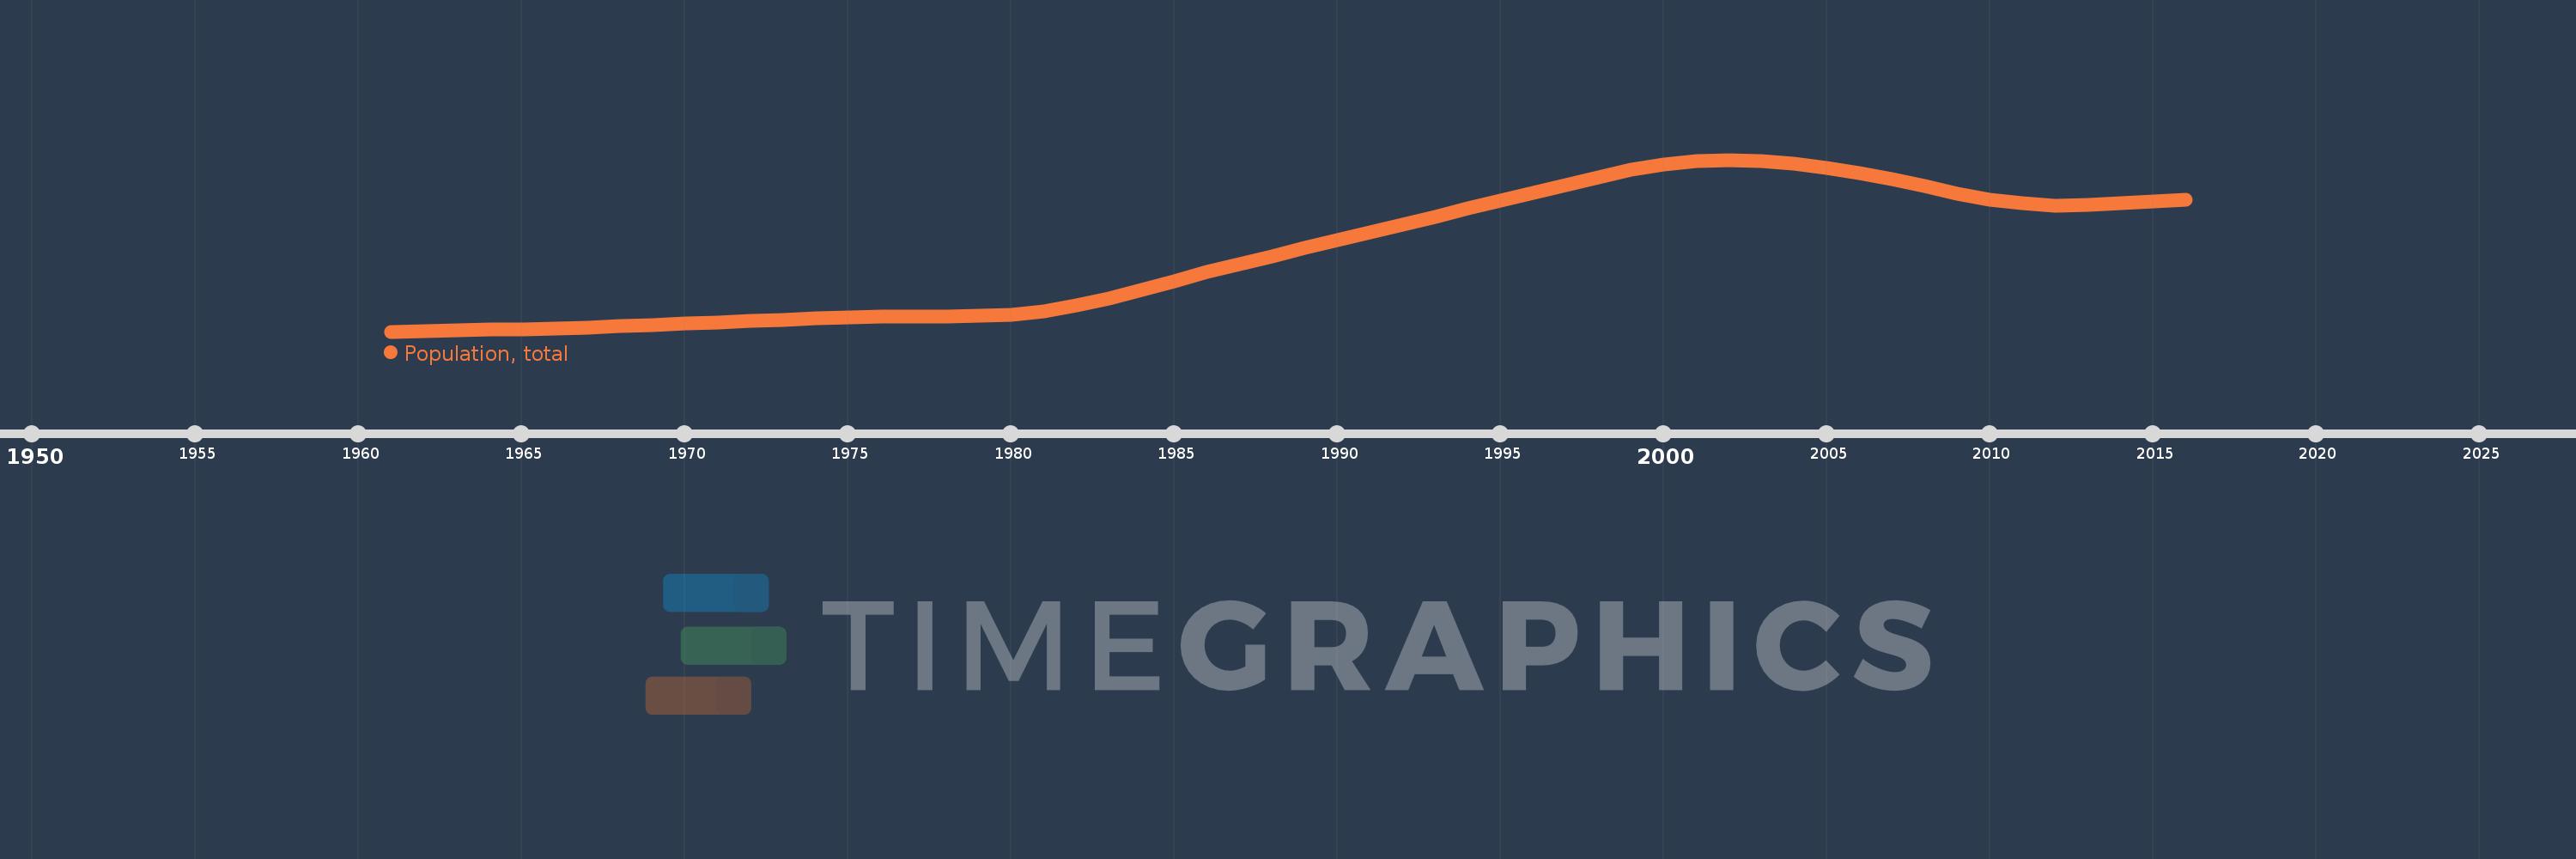
Population, total
2016,2015,2014,2013,2012,2011,2010,2009,2008,2007,2006,2005,2004,2003,2002,2001,2000,1999,1998,1997,1996,1995,1994,1993,1992,1991,1990,1989,1988,1987,1986,1985,1984,1983,1982,1981,1980,1979,1978,1977,1976,1975,1974,1973,1972,1971,1970,1969,1968,1967,1966,1965,1964,1963,1962,1961
This statistics in other country:
AfghanistanAlbaniaAlgeriaAmerican SamoaAndorraAngolaAntigua and BarbudaArab WorldArgentinaArmeniaArubaAustraliaAustriaAzerbaijanBahamas, TheBahrainBangladeshBarbadosBelarusBelgiumBelizeBeninBermudaBhutanBoliviaBosnia and HerzegovinaBotswanaBrazilBritish Virgin IslandsBrunei DarussalamBulgariaBurkina FasoBurundiCabo VerdeCambodiaCameroonCanadaCaribbean small statesCayman IslandsCentral African RepublicCentral Europe and the BalticsChadChannel IslandsChileChinaColombiaComorosCongo, Dem. Rep.Congo, Rep.Costa RicaCote d'IvoireCroatiaCubaCuracaoCyprusCzech RepublicDenmarkDjiboutiDominicaDominican RepublicEarly-demographic dividendEast Asia & PacificEast Asia & Pacific (excluding high income)East Asia & Pacific (IDA & IBRD countries)EcuadorEgypt, Arab Rep.El SalvadorEquatorial GuineaEritreaEstoniaEthiopiaEuro areaEurope & Central AsiaEurope & Central Asia (excluding high income)Europe & Central Asia (IDA & IBRD countries)European UnionFaroe IslandsFijiFinlandFragile and conflict affected situationsFranceFrench PolynesiaGabonGambia, TheGeorgiaGermanyGhanaGibraltarGreeceGreenlandGrenadaGuamGuatemalaGuineaGuinea-BissauGuyanaHaitiHeavily indebted poor countries (HIPC)High incomeHondurasHong Kong SAR, ChinaHungaryIBRD onlyIcelandIDA & IBRD totalIDA blendIDA onlyIDA totalIndiaIndonesiaIran, Islamic Rep.IraqIrelandIsle of ManIsraelItalyJamaicaJapanJordanKazakhstanKenyaKiribatiKorea, Dem. People’s Rep.Korea, Rep.KosovoKuwaitKyrgyz RepublicLao PDRLate-demographic dividendLatin America & Caribbean Latin America & Caribbean (excluding high income)Latin America & the Caribbean (IDA & IBRD countries)LatviaLeast developed countries: UN classificationLebanonLesothoLiberiaLibyaLiechtensteinLithuaniaLow & middle incomeLow incomeLower middle incomeLuxembourgMacao SAR, ChinaMacedonia, FYRMadagascarMalawiMalaysiaMaldivesMaliMaltaMarshall IslandsMauritaniaMauritiusMexicoMicronesia, Fed. Sts.Middle East & North AfricaMiddle East & North Africa (excluding high income)Middle East & North Africa (IDA & IBRD countries)Middle incomeMoldovaMonacoMongoliaMontenegroMoroccoMozambiqueMyanmarNamibiaNauruNepalNetherlandsNew CaledoniaNew ZealandNicaraguaNigerNigeriaNorth AmericaNorthern Mariana IslandsNorwayOECD membersOmanOther small statesPacific island small statesPakistanPalauPanamaPapua New GuineaParaguayPeruPhilippinesPolandPortugalPost-demographic dividendPre-demographic dividendPuerto RicoQatarRomaniaRussian FederationRwandaSamoaSan MarinoSao Tome and PrincipeSaudi ArabiaSenegalSerbiaSeychellesSierra LeoneSingaporeSint Maarten (Dutch part)Slovak RepublicSloveniaSmall statesSolomon IslandsSomaliaSouth AfricaSouth AsiaSouth Asia (IDA & IBRD)South SudanSpainSri LankaSt. Kitts and NevisSt. LuciaSt. Martin (French part)St. Vincent and the GrenadinesSub-Saharan Africa Sub-Saharan Africa (excluding high income)Sub-Saharan Africa (IDA & IBRD countries)SudanSurinameSwazilandSwedenSwitzerlandSyrian Arab RepublicTajikistanTanzaniaThailandTimor-LesteTogoTongaTrinidad and TobagoTunisiaTurkeyTurkmenistanTurks and Caicos IslandsTuvaluUgandaUkraineUnited Arab EmiratesUnited KingdomUnited StatesUpper middle incomeUruguayUzbekistanVanuatuVenezuela, RBVietnamVirgin Islands (U.S.)West Bank and GazaWorldYemen, Rep.ZambiaZimbabwe Timeline:
This timeline shows a graph from 1961 to 2016 of Northern Mariana Islands. No data until 1960. Number of actual observations by date: 56.
Source name:
World Development Indicators
Source organization:
(1) United Nations Population Division. World Population Prospects, (2) Census reports and other statistical publications from national statistical offices, (3) Eurostat: Demographic Statistics, (4) United Nations Statistical Division. Population and Vital Statistics Report (various years), (5) U.S. Census Bureau: International Database, and (6) Secretariat of the Pacific Community: Statistics and Demography Programme.
Categories, topics:
Climate Change, Health
Last updated:
apr 23, 2017
Indicators value changes by year
Minimum:
10.07K
jan 1, 1961
Maximum:
68.817K
jan 1, 2002
At the date of observation
Value
Absolute change
Change from previous value
jan 1, 1961
10.07K
+10.07K
0.0%
jan 1, 1962
10.34K
+270.0
2.68%
jan 1, 1963
10.541K
+201.0
1.94%
jan 1, 1964
10.709K
+168.0
1.59%
jan 1, 1965
10.901K
+192.0
1.79%
jan 1, 1966
11.157K
+256.0
2.35%
jan 1, 1967
11.489K
+332.0
2.98%
jan 1, 1968
11.882K
+393.0
3.42%
jan 1, 1969
12.318K
+436.0
3.67%
jan 1, 1970
12.766K
+448.0
3.64%
jan 1, 1971
13.203K
+437.0
3.42%
jan 1, 1972
13.658K
+455.0
3.45%
jan 1, 1973
14.142K
+484.0
3.54%
jan 1, 1974
14.605K
+463.0
3.27%
jan 1, 1975
14.978K
+373.0
2.55%
jan 1, 1976
15.232K
+254.0
1.7%
jan 1, 1977
15.316K
+84.0
0.55%
jan 1, 1978
15.293K
-23.0
-0.15%
jan 1, 1979
15.39K
+97.0
0.63%
jan 1, 1980
15.906K
+516.0
3.35%
jan 1, 1981
17.048K
+1.142K
7.18%
jan 1, 1982
18.906K
+1.858K
10.9%
jan 1, 1983
21.393K
+2.487K
13.15%
jan 1, 1984
24.308K
+2.915K
13.63%
jan 1, 1985
27.363K
+3.055K
12.57%
jan 1, 1986
30.341K
+2.978K
10.88%
jan 1, 1987
33.173K
+2.832K
9.33%
jan 1, 1988
35.904K
+2.731K
8.23%
jan 1, 1989
38.57K
+2.666K
7.43%
jan 1, 1990
41.243K
+2.673K
6.93%
jan 1, 1991
43.972K
+2.729K
6.62%
jan 1, 1992
46.719K
+2.747K
6.25%
jan 1, 1993
49.429K
+2.71K
5.8%
jan 1, 1994
52.12K
+2.691K
5.44%
jan 1, 1995
54.817K
+2.697K
5.17%
jan 1, 1996
57.518K
+2.701K
4.93%
jan 1, 1997
60.248K
+2.73K
4.75%
jan 1, 1998
62.939K
+2.691K
4.47%
jan 1, 1999
65.374K
+2.435K
3.87%
jan 1, 2000
67.271K
+1.897K
2.9%
jan 1, 2001
68.434K
+1.163K
1.73%
jan 1, 2002
68.817K
+383.0
0.56%
jan 1, 2003
68.499K
-318.0
-0.46%
jan 1, 2004
67.562K
-937.0
-1.37%
jan 1, 2005
66.143K
-1.419K
-2.1%
jan 1, 2006
64.372K
-1.771K
-2.68%
jan 1, 2007
62.235K
-2.137K
-3.32%
jan 1, 2008
59.791K
-2.444K
-3.93%
jan 1, 2009
57.343K
-2.448K
-4.09%
jan 1, 2010
55.276K
-2.067K
-3.6%
jan 1, 2011
53.86K
-1.416K
-2.56%
jan 1, 2012
53.234K
-626.0
-1.16%
jan 1, 2013
53.314K
+80.0
0.15%
jan 1, 2014
53.869K
+555.0
1.04%
jan 1, 2015
54.541K
+672.0
1.25%
jan 1, 2016
55.07K
+529.0
0.97%
Ranking of countries by current statistics by years


Comments: