29
/
en
AIzaSyAYiBZKx7MnpbEhh9jyipgxe19OcubqV5w
April 1, 2024
281491
Venezuela, RB
VEN
true
2
1
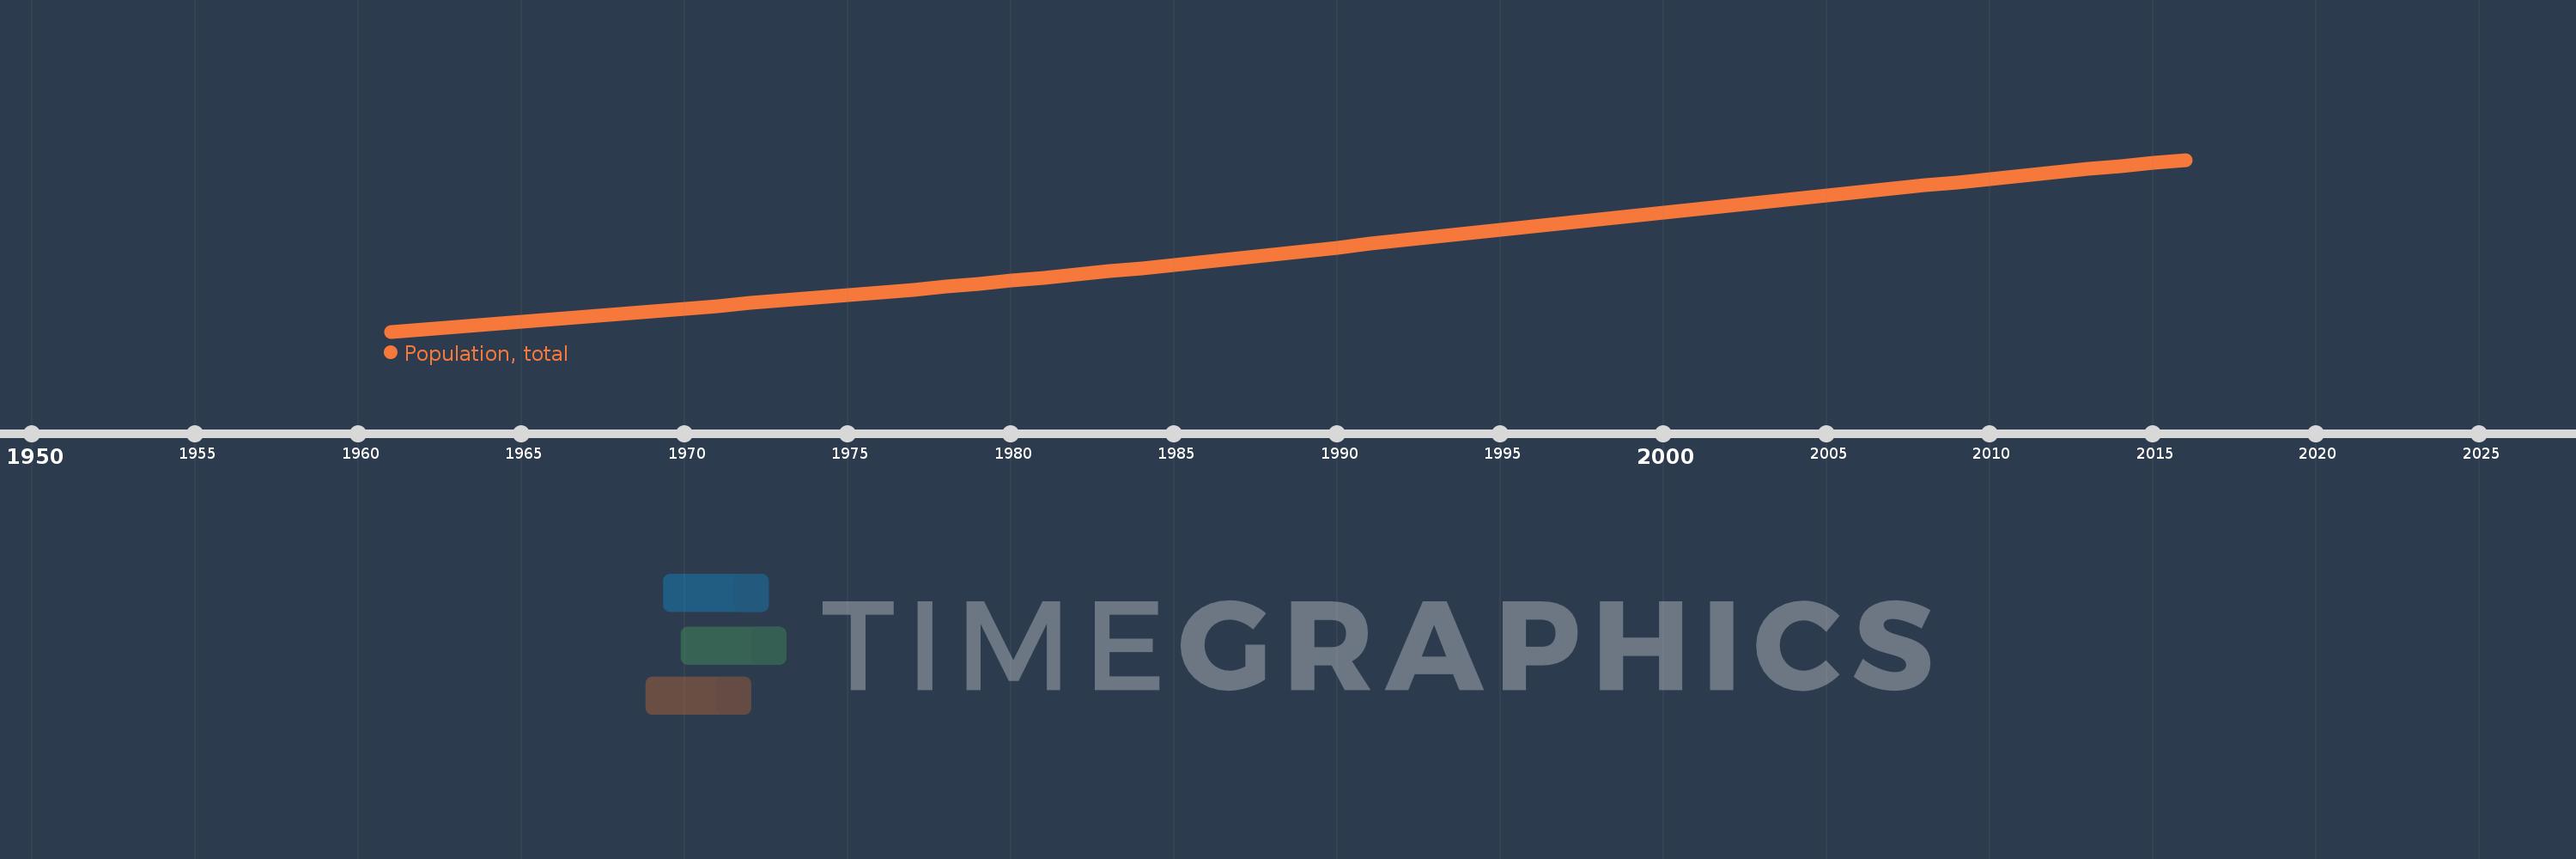
Population, total
2016,2015,2014,2013,2012,2011,2010,2009,2008,2007,2006,2005,2004,2003,2002,2001,2000,1999,1998,1997,1996,1995,1994,1993,1992,1991,1990,1989,1988,1987,1986,1985,1984,1983,1982,1981,1980,1979,1978,1977,1976,1975,1974,1973,1972,1971,1970,1969,1968,1967,1966,1965,1964,1963,1962,1961
This statistics in other country:
AfghanistanAlbaniaAlgeriaAmerican SamoaAndorraAngolaAntigua and BarbudaArab WorldArgentinaArmeniaArubaAustraliaAustriaAzerbaijanBahamas, TheBahrainBangladeshBarbadosBelarusBelgiumBelizeBeninBermudaBhutanBoliviaBosnia and HerzegovinaBotswanaBrazilBritish Virgin IslandsBrunei DarussalamBulgariaBurkina FasoBurundiCabo VerdeCambodiaCameroonCanadaCaribbean small statesCayman IslandsCentral African RepublicCentral Europe and the BalticsChadChannel IslandsChileChinaColombiaComorosCongo, Dem. Rep.Congo, Rep.Costa RicaCote d'IvoireCroatiaCubaCuracaoCyprusCzech RepublicDenmarkDjiboutiDominicaDominican RepublicEarly-demographic dividendEast Asia & PacificEast Asia & Pacific (excluding high income)East Asia & Pacific (IDA & IBRD countries)EcuadorEgypt, Arab Rep.El SalvadorEquatorial GuineaEritreaEstoniaEthiopiaEuro areaEurope & Central AsiaEurope & Central Asia (excluding high income)Europe & Central Asia (IDA & IBRD countries)European UnionFaroe IslandsFijiFinlandFragile and conflict affected situationsFranceFrench PolynesiaGabonGambia, TheGeorgiaGermanyGhanaGibraltarGreeceGreenlandGrenadaGuamGuatemalaGuineaGuinea-BissauGuyanaHaitiHeavily indebted poor countries (HIPC)High incomeHondurasHong Kong SAR, ChinaHungaryIBRD onlyIcelandIDA & IBRD totalIDA blendIDA onlyIDA totalIndiaIndonesiaIran, Islamic Rep.IraqIrelandIsle of ManIsraelItalyJamaicaJapanJordanKazakhstanKenyaKiribatiKorea, Dem. People’s Rep.Korea, Rep.KosovoKuwaitKyrgyz RepublicLao PDRLate-demographic dividendLatin America & Caribbean Latin America & Caribbean (excluding high income)Latin America & the Caribbean (IDA & IBRD countries)LatviaLeast developed countries: UN classificationLebanonLesothoLiberiaLibyaLiechtensteinLithuaniaLow & middle incomeLow incomeLower middle incomeLuxembourgMacao SAR, ChinaMacedonia, FYRMadagascarMalawiMalaysiaMaldivesMaliMaltaMarshall IslandsMauritaniaMauritiusMexicoMicronesia, Fed. Sts.Middle East & North AfricaMiddle East & North Africa (excluding high income)Middle East & North Africa (IDA & IBRD countries)Middle incomeMoldovaMonacoMongoliaMontenegroMoroccoMozambiqueMyanmarNamibiaNauruNepalNetherlandsNew CaledoniaNew ZealandNicaraguaNigerNigeriaNorth AmericaNorthern Mariana IslandsNorwayOECD membersOmanOther small statesPacific island small statesPakistanPalauPanamaPapua New GuineaParaguayPeruPhilippinesPolandPortugalPost-demographic dividendPre-demographic dividendPuerto RicoQatarRomaniaRussian FederationRwandaSamoaSan MarinoSao Tome and PrincipeSaudi ArabiaSenegalSerbiaSeychellesSierra LeoneSingaporeSint Maarten (Dutch part)Slovak RepublicSloveniaSmall statesSolomon IslandsSomaliaSouth AfricaSouth AsiaSouth Asia (IDA & IBRD)South SudanSpainSri LankaSt. Kitts and NevisSt. LuciaSt. Martin (French part)St. Vincent and the GrenadinesSub-Saharan Africa Sub-Saharan Africa (excluding high income)Sub-Saharan Africa (IDA & IBRD countries)SudanSurinameSwazilandSwedenSwitzerlandSyrian Arab RepublicTajikistanTanzaniaThailandTimor-LesteTogoTongaTrinidad and TobagoTunisiaTurkeyTurkmenistanTurks and Caicos IslandsTuvaluUgandaUkraineUnited Arab EmiratesUnited KingdomUnited StatesUpper middle incomeUruguayUzbekistanVanuatuVenezuela, RBVietnamVirgin Islands (U.S.)West Bank and GazaWorldYemen, Rep.ZambiaZimbabwe Timeline:
This timeline shows a graph from 1961 to 2016 of Venezuela, RB. No data until 1960. Number of actual observations by date: 56.
Source name:
World Development Indicators
Source organization:
(1) United Nations Population Division. World Population Prospects, (2) Census reports and other statistical publications from national statistical offices, (3) Eurostat: Demographic Statistics, (4) United Nations Statistical Division. Population and Vital Statistics Report (various years), (5) U.S. Census Bureau: International Database, and (6) Secretariat of the Pacific Community: Statistics and Demography Programme.
Categories, topics:
Climate Change, Health
Last updated:
apr 23, 2017
Indicators value changes by year
Minimum:
8.147 mln
jan 1, 1961
Maximum:
31.108 mln
jan 1, 2016
At the date of observation
Value
Absolute change
Change from previous value
jan 1, 1961
8.147 mln
+8.147 mln
0.0%
jan 1, 1962
8.462 mln
+314.839K
3.86%
jan 1, 1963
8.791 mln
+328.906K
3.89%
jan 1, 1964
9.13 mln
+339.756K
3.86%
jan 1, 1965
9.476 mln
+345.909K
3.79%
jan 1, 1966
9.825 mln
+348.439K
3.68%
jan 1, 1967
10.175 mln
+350.449K
3.57%
jan 1, 1968
10.528 mln
+352.911K
3.47%
jan 1, 1969
10.882 mln
+353.941K
3.36%
jan 1, 1970
11.235 mln
+353.497K
3.25%
jan 1, 1971
11.588 mln
+352.266K
3.14%
jan 1, 1972
11.938 mln
+350.045K
3.02%
jan 1, 1973
12.286 mln
+348.631K
2.92%
jan 1, 1974
12.637 mln
+350.537K
2.85%
jan 1, 1975
12.994 mln
+357.054K
2.83%
jan 1, 1976
13.361 mln
+366.963K
2.82%
jan 1, 1977
13.739 mln
+378.154K
2.83%
jan 1, 1978
14.128 mln
+388.648K
2.83%
jan 1, 1979
14.526 mln
+398.139K
2.82%
jan 1, 1980
14.932 mln
+405.812K
2.79%
jan 1, 1981
15.344 mln
+412.176K
2.76%
jan 1, 1982
15.762 mln
+417.883K
2.72%
jan 1, 1983
16.186 mln
+424.095K
2.69%
jan 1, 1984
16.617 mln
+431.448K
2.67%
jan 1, 1985
17.058 mln
+440.443K
2.65%
jan 1, 1986
17.508 mln
+450.273K
2.64%
jan 1, 1987
17.969 mln
+460.471K
2.63%
jan 1, 1988
18.438 mln
+469.207K
2.61%
jan 1, 1989
18.912 mln
+474.694K
2.57%
jan 1, 1990
19.388 mln
+475.831K
2.52%
jan 1, 1991
19.862 mln
+473.697K
2.44%
jan 1, 1992
20.332 mln
+470.288K
2.37%
jan 1, 1993
20.799 mln
+467.224K
2.3%
jan 1, 1994
21.264 mln
+464.523K
2.23%
jan 1, 1995
21.727 mln
+462.814K
2.18%
jan 1, 1996
22.189 mln
+461.863K
2.13%
jan 1, 1997
22.649 mln
+460.541K
2.08%
jan 1, 1998
23.108 mln
+458.791K
2.03%
jan 1, 1999
23.566 mln
+457.731K
1.98%
jan 1, 2000
24.023 mln
+457.621K
1.94%
jan 1, 2001
24.481 mln
+458.122K
1.91%
jan 1, 2002
24.94 mln
+458.746K
1.87%
jan 1, 2003
25.399 mln
+458.92K
1.84%
jan 1, 2004
25.858 mln
+458.41K
1.8%
jan 1, 2005
26.314 mln
+456.93K
1.77%
jan 1, 2006
26.769 mln
+454.632K
1.73%
jan 1, 2007
27.221 mln
+452.113K
1.69%
jan 1, 2008
27.671 mln
+449.431K
1.65%
jan 1, 2009
28.117 mln
+446.057K
1.61%
jan 1, 2010
28.559 mln
+441.891K
1.57%
jan 1, 2011
28.996 mln
+437.138K
1.53%
jan 1, 2012
29.428 mln
+431.886K
1.49%
jan 1, 2013
29.854 mln
+426.607K
1.45%
jan 1, 2014
30.276 mln
+421.807K
1.41%
jan 1, 2015
30.694 mln
+417.782K
1.38%
jan 1, 2016
31.108 mln
+414.256K
1.35%
Ranking of countries by current statistics by years


Comments: