29
/
en
AIzaSyAYiBZKx7MnpbEhh9jyipgxe19OcubqV5w
April 1, 2024
158852
Iraq
IRQ
true
2
1
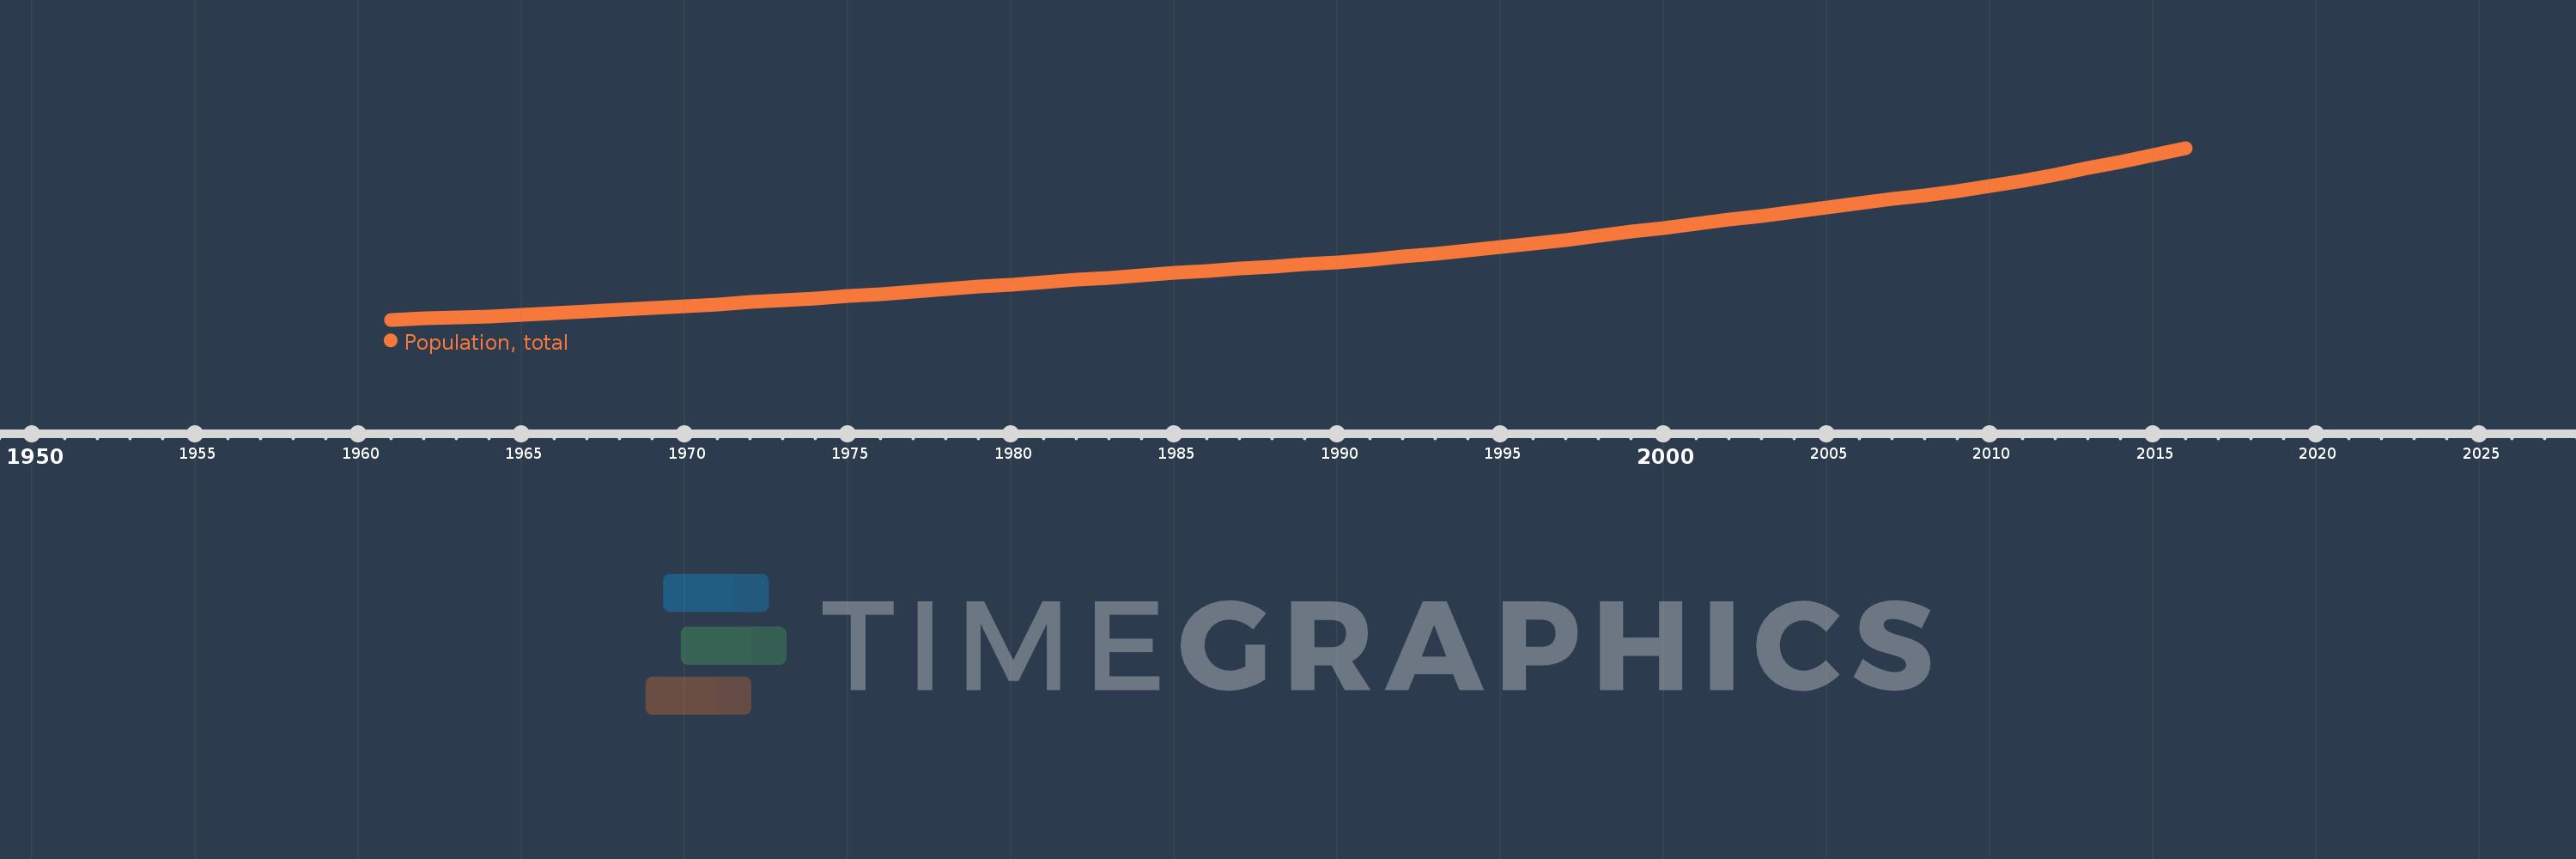
Population, total
2016,2015,2014,2013,2012,2011,2010,2009,2008,2007,2006,2005,2004,2003,2002,2001,2000,1999,1998,1997,1996,1995,1994,1993,1992,1991,1990,1989,1988,1987,1986,1985,1984,1983,1982,1981,1980,1979,1978,1977,1976,1975,1974,1973,1972,1971,1970,1969,1968,1967,1966,1965,1964,1963,1962,1961
This statistics in other country:
AfghanistanAlbaniaAlgeriaAmerican SamoaAndorraAngolaAntigua and BarbudaArab WorldArgentinaArmeniaArubaAustraliaAustriaAzerbaijanBahamas, TheBahrainBangladeshBarbadosBelarusBelgiumBelizeBeninBermudaBhutanBoliviaBosnia and HerzegovinaBotswanaBrazilBritish Virgin IslandsBrunei DarussalamBulgariaBurkina FasoBurundiCabo VerdeCambodiaCameroonCanadaCaribbean small statesCayman IslandsCentral African RepublicCentral Europe and the BalticsChadChannel IslandsChileChinaColombiaComorosCongo, Dem. Rep.Congo, Rep.Costa RicaCote d'IvoireCroatiaCubaCuracaoCyprusCzech RepublicDenmarkDjiboutiDominicaDominican RepublicEarly-demographic dividendEast Asia & PacificEast Asia & Pacific (excluding high income)East Asia & Pacific (IDA & IBRD countries)EcuadorEgypt, Arab Rep.El SalvadorEquatorial GuineaEritreaEstoniaEthiopiaEuro areaEurope & Central AsiaEurope & Central Asia (excluding high income)Europe & Central Asia (IDA & IBRD countries)European UnionFaroe IslandsFijiFinlandFragile and conflict affected situationsFranceFrench PolynesiaGabonGambia, TheGeorgiaGermanyGhanaGibraltarGreeceGreenlandGrenadaGuamGuatemalaGuineaGuinea-BissauGuyanaHaitiHeavily indebted poor countries (HIPC)High incomeHondurasHong Kong SAR, ChinaHungaryIBRD onlyIcelandIDA & IBRD totalIDA blendIDA onlyIDA totalIndiaIndonesiaIran, Islamic Rep.IraqIrelandIsle of ManIsraelItalyJamaicaJapanJordanKazakhstanKenyaKiribatiKorea, Dem. People’s Rep.Korea, Rep.KosovoKuwaitKyrgyz RepublicLao PDRLate-demographic dividendLatin America & Caribbean Latin America & Caribbean (excluding high income)Latin America & the Caribbean (IDA & IBRD countries)LatviaLeast developed countries: UN classificationLebanonLesothoLiberiaLibyaLiechtensteinLithuaniaLow & middle incomeLow incomeLower middle incomeLuxembourgMacao SAR, ChinaMacedonia, FYRMadagascarMalawiMalaysiaMaldivesMaliMaltaMarshall IslandsMauritaniaMauritiusMexicoMicronesia, Fed. Sts.Middle East & North AfricaMiddle East & North Africa (excluding high income)Middle East & North Africa (IDA & IBRD countries)Middle incomeMoldovaMonacoMongoliaMontenegroMoroccoMozambiqueMyanmarNamibiaNauruNepalNetherlandsNew CaledoniaNew ZealandNicaraguaNigerNigeriaNorth AmericaNorthern Mariana IslandsNorwayOECD membersOmanOther small statesPacific island small statesPakistanPalauPanamaPapua New GuineaParaguayPeruPhilippinesPolandPortugalPost-demographic dividendPre-demographic dividendPuerto RicoQatarRomaniaRussian FederationRwandaSamoaSan MarinoSao Tome and PrincipeSaudi ArabiaSenegalSerbiaSeychellesSierra LeoneSingaporeSint Maarten (Dutch part)Slovak RepublicSloveniaSmall statesSolomon IslandsSomaliaSouth AfricaSouth AsiaSouth Asia (IDA & IBRD)South SudanSpainSri LankaSt. Kitts and NevisSt. LuciaSt. Martin (French part)St. Vincent and the GrenadinesSub-Saharan Africa Sub-Saharan Africa (excluding high income)Sub-Saharan Africa (IDA & IBRD countries)SudanSurinameSwazilandSwedenSwitzerlandSyrian Arab RepublicTajikistanTanzaniaThailandTimor-LesteTogoTongaTrinidad and TobagoTunisiaTurkeyTurkmenistanTurks and Caicos IslandsTuvaluUgandaUkraineUnited Arab EmiratesUnited KingdomUnited StatesUpper middle incomeUruguayUzbekistanVanuatuVenezuela, RBVietnamVirgin Islands (U.S.)West Bank and GazaWorldYemen, Rep.ZambiaZimbabwe Timeline:
This timeline shows a graph from 1961 to 2016 of Iraq. No data until 1960. Number of actual observations by date: 56.
Source name:
World Development Indicators
Source organization:
(1) United Nations Population Division. World Population Prospects, (2) Census reports and other statistical publications from national statistical offices, (3) Eurostat: Demographic Statistics, (4) United Nations Statistical Division. Population and Vital Statistics Report (various years), (5) U.S. Census Bureau: International Database, and (6) Secretariat of the Pacific Community: Statistics and Demography Programme.
Categories, topics:
Climate Change, Health
Last updated:
apr 23, 2017
Indicators value changes by year
Minimum:
7.29 mln
jan 1, 1961
Maximum:
36.423 mln
jan 1, 2016
At the date of observation
Value
Absolute change
Change from previous value
jan 1, 1961
7.29 mln
+7.29 mln
0.0%
jan 1, 1962
7.475 mln
+185.595K
2.55%
jan 1, 1963
7.674 mln
+198.866K
2.66%
jan 1, 1964
7.889 mln
+214.694K
2.8%
jan 1, 1965
8.122 mln
+233.286K
2.96%
jan 1, 1966
8.376 mln
+253.591K
3.12%
jan 1, 1967
8.651 mln
+275.376K
3.29%
jan 1, 1968
8.947 mln
+296.232K
3.42%
jan 1, 1969
9.261 mln
+313.286K
3.5%
jan 1, 1970
9.586 mln
+324.891K
3.51%
jan 1, 1971
9.918 mln
+332.406K
3.47%
jan 1, 1972
10.256 mln
+337.922K
3.41%
jan 1, 1973
10.6 mln
+343.942K
3.35%
jan 1, 1974
10.951 mln
+351.323K
3.31%
jan 1, 1975
11.312 mln
+361.135K
3.3%
jan 1, 1976
11.685 mln
+372.281K
3.29%
jan 1, 1977
12.068 mln
+383.61K
3.28%
jan 1, 1978
12.461 mln
+392.802K
3.25%
jan 1, 1979
12.859 mln
+398.229K
3.2%
jan 1, 1980
13.258 mln
+398.684K
3.1%
jan 1, 1981
13.653 mln
+395.448K
2.98%
jan 1, 1982
14.046 mln
+392.915K
2.88%
jan 1, 1983
14.438 mln
+391.388K
2.79%
jan 1, 1984
14.825 mln
+387.215K
2.68%
jan 1, 1985
15.205 mln
+379.87K
2.56%
jan 1, 1986
15.576 mln
+371.65K
2.44%
jan 1, 1987
15.938 mln
+361.468K
2.32%
jan 1, 1988
16.294 mln
+355.855K
2.23%
jan 1, 1989
16.658 mln
+363.989K
2.23%
jan 1, 1990
17.048 mln
+390.459K
2.34%
jan 1, 1991
17.478 mln
+430.288K
2.52%
jan 1, 1992
17.953 mln
+474.454K
2.71%
jan 1, 1993
18.469 mln
+515.612K
2.87%
jan 1, 1994
19.022 mln
+553.446K
3.0%
jan 1, 1995
19.607 mln
+584.928K
3.08%
jan 1, 1996
20.218 mln
+610.864K
3.12%
jan 1, 1997
20.855 mln
+637.649K
3.15%
jan 1, 1998
21.519 mln
+663.948K
3.18%
jan 1, 1999
22.201 mln
+681.479K
3.17%
jan 1, 2000
22.889 mln
+687.765K
3.1%
jan 1, 2001
23.575 mln
+686.151K
3.0%
jan 1, 2002
24.259 mln
+684.043K
2.9%
jan 1, 2003
24.944 mln
+684.999K
2.82%
jan 1, 2004
25.63 mln
+686.633K
2.75%
jan 1, 2005
26.321 mln
+690.104K
2.69%
jan 1, 2006
27.018 mln
+697.182K
2.65%
jan 1, 2007
27.717 mln
+699.271K
2.59%
jan 1, 2008
28.424 mln
+706.555K
2.55%
jan 1, 2009
29.163 mln
+739.789K
2.6%
jan 1, 2010
29.971 mln
+807.307K
2.77%
jan 1, 2011
30.868 mln
+897.522K
2.99%
jan 1, 2012
31.868 mln
+999.602K
3.24%
jan 1, 2013
32.958 mln
+1.09 mln
3.42%
jan 1, 2014
34.107 mln
+1.15 mln
3.49%
jan 1, 2015
35.273 mln
+1.166 mln
3.42%
jan 1, 2016
36.423 mln
+1.15 mln
3.26%
Ranking of countries by current statistics by years


Comments: