29
/
en
AIzaSyAYiBZKx7MnpbEhh9jyipgxe19OcubqV5w
April 1, 2024
114089
Cote d'Ivoire
CIV
true
2
1
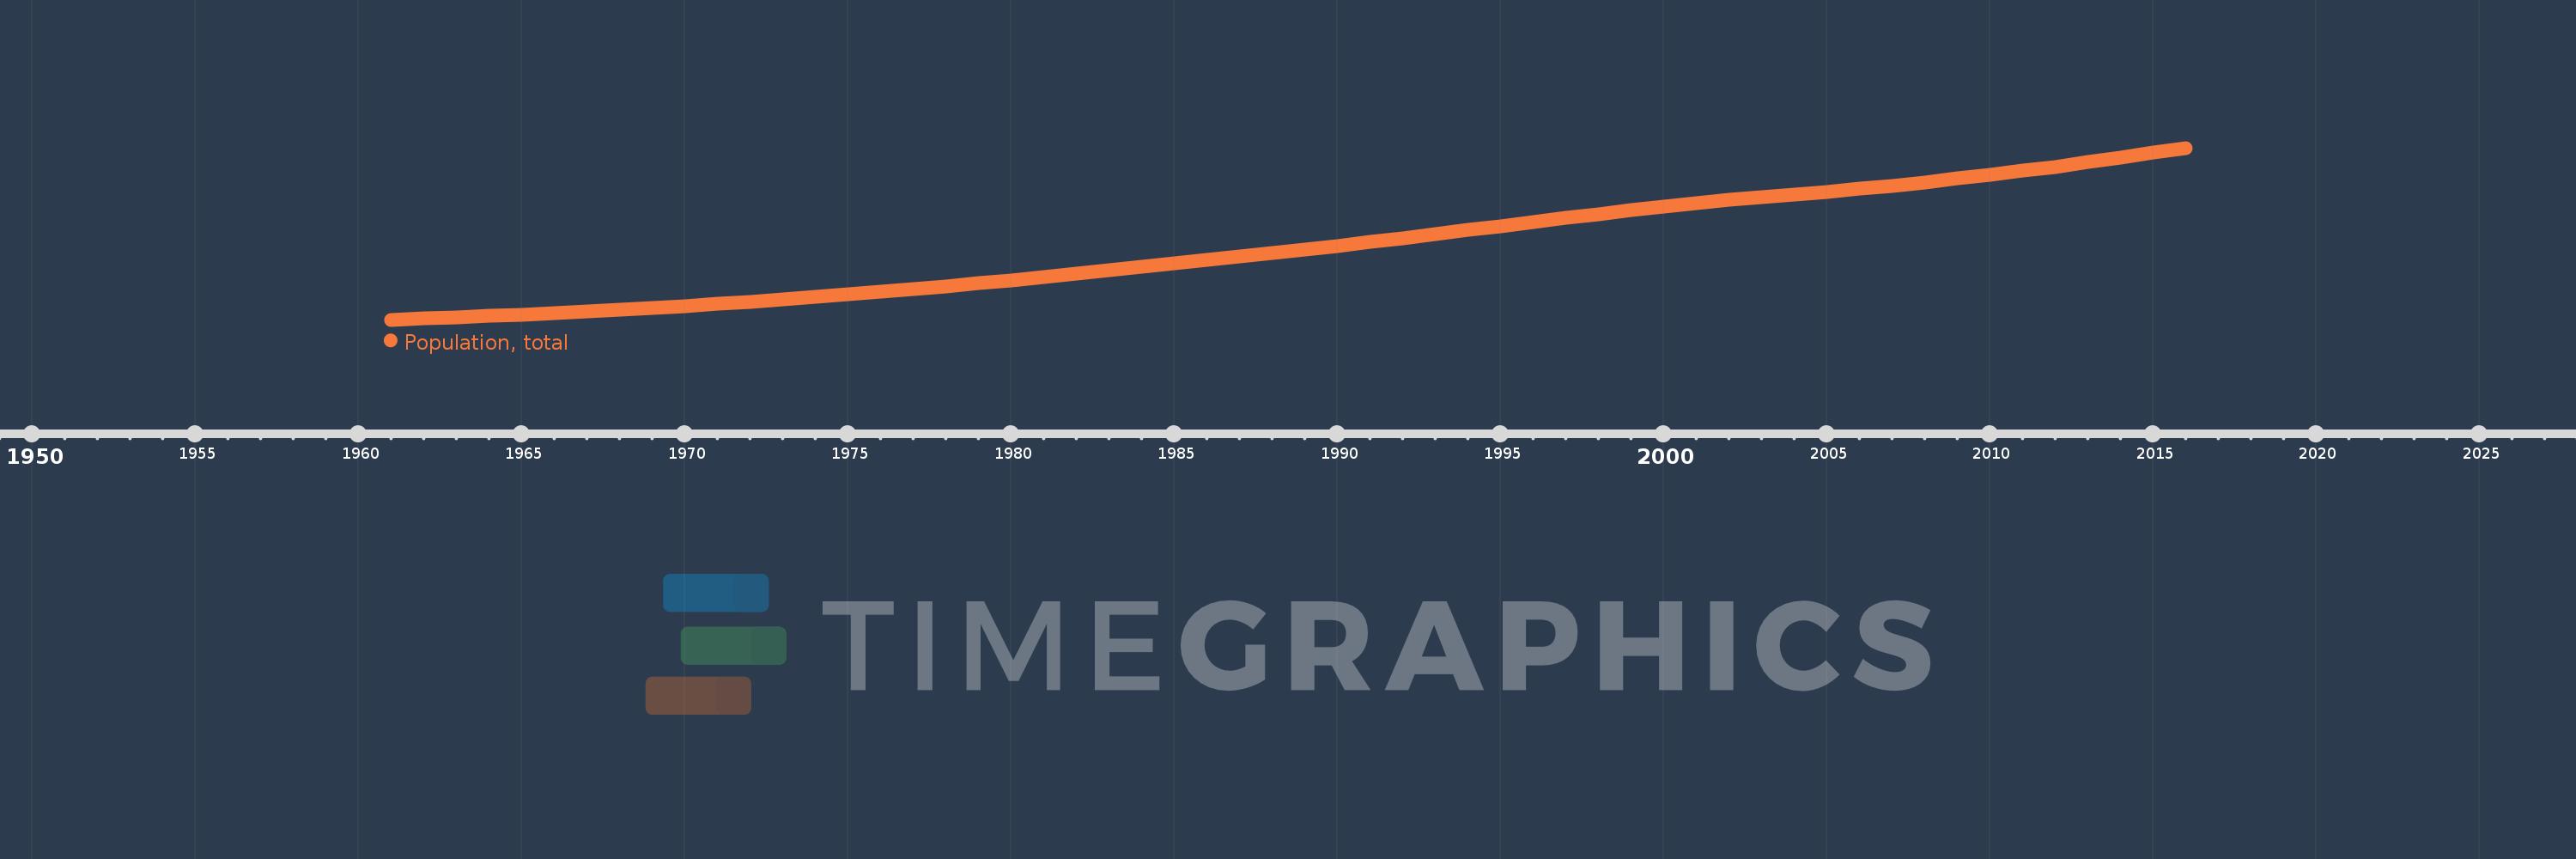
Population, total
2016,2015,2014,2013,2012,2011,2010,2009,2008,2007,2006,2005,2004,2003,2002,2001,2000,1999,1998,1997,1996,1995,1994,1993,1992,1991,1990,1989,1988,1987,1986,1985,1984,1983,1982,1981,1980,1979,1978,1977,1976,1975,1974,1973,1972,1971,1970,1969,1968,1967,1966,1965,1964,1963,1962,1961
This statistics in other country:
AfghanistanAlbaniaAlgeriaAmerican SamoaAndorraAngolaAntigua and BarbudaArab WorldArgentinaArmeniaArubaAustraliaAustriaAzerbaijanBahamas, TheBahrainBangladeshBarbadosBelarusBelgiumBelizeBeninBermudaBhutanBoliviaBosnia and HerzegovinaBotswanaBrazilBritish Virgin IslandsBrunei DarussalamBulgariaBurkina FasoBurundiCabo VerdeCambodiaCameroonCanadaCaribbean small statesCayman IslandsCentral African RepublicCentral Europe and the BalticsChadChannel IslandsChileChinaColombiaComorosCongo, Dem. Rep.Congo, Rep.Costa RicaCote d'IvoireCroatiaCubaCuracaoCyprusCzech RepublicDenmarkDjiboutiDominicaDominican RepublicEarly-demographic dividendEast Asia & PacificEast Asia & Pacific (excluding high income)East Asia & Pacific (IDA & IBRD countries)EcuadorEgypt, Arab Rep.El SalvadorEquatorial GuineaEritreaEstoniaEthiopiaEuro areaEurope & Central AsiaEurope & Central Asia (excluding high income)Europe & Central Asia (IDA & IBRD countries)European UnionFaroe IslandsFijiFinlandFragile and conflict affected situationsFranceFrench PolynesiaGabonGambia, TheGeorgiaGermanyGhanaGibraltarGreeceGreenlandGrenadaGuamGuatemalaGuineaGuinea-BissauGuyanaHaitiHeavily indebted poor countries (HIPC)High incomeHondurasHong Kong SAR, ChinaHungaryIBRD onlyIcelandIDA & IBRD totalIDA blendIDA onlyIDA totalIndiaIndonesiaIran, Islamic Rep.IraqIrelandIsle of ManIsraelItalyJamaicaJapanJordanKazakhstanKenyaKiribatiKorea, Dem. People’s Rep.Korea, Rep.KosovoKuwaitKyrgyz RepublicLao PDRLate-demographic dividendLatin America & Caribbean Latin America & Caribbean (excluding high income)Latin America & the Caribbean (IDA & IBRD countries)LatviaLeast developed countries: UN classificationLebanonLesothoLiberiaLibyaLiechtensteinLithuaniaLow & middle incomeLow incomeLower middle incomeLuxembourgMacao SAR, ChinaMacedonia, FYRMadagascarMalawiMalaysiaMaldivesMaliMaltaMarshall IslandsMauritaniaMauritiusMexicoMicronesia, Fed. Sts.Middle East & North AfricaMiddle East & North Africa (excluding high income)Middle East & North Africa (IDA & IBRD countries)Middle incomeMoldovaMonacoMongoliaMontenegroMoroccoMozambiqueMyanmarNamibiaNauruNepalNetherlandsNew CaledoniaNew ZealandNicaraguaNigerNigeriaNorth AmericaNorthern Mariana IslandsNorwayOECD membersOmanOther small statesPacific island small statesPakistanPalauPanamaPapua New GuineaParaguayPeruPhilippinesPolandPortugalPost-demographic dividendPre-demographic dividendPuerto RicoQatarRomaniaRussian FederationRwandaSamoaSan MarinoSao Tome and PrincipeSaudi ArabiaSenegalSerbiaSeychellesSierra LeoneSingaporeSint Maarten (Dutch part)Slovak RepublicSloveniaSmall statesSolomon IslandsSomaliaSouth AfricaSouth AsiaSouth Asia (IDA & IBRD)South SudanSpainSri LankaSt. Kitts and NevisSt. LuciaSt. Martin (French part)St. Vincent and the GrenadinesSub-Saharan Africa Sub-Saharan Africa (excluding high income)Sub-Saharan Africa (IDA & IBRD countries)SudanSurinameSwazilandSwedenSwitzerlandSyrian Arab RepublicTajikistanTanzaniaThailandTimor-LesteTogoTongaTrinidad and TobagoTunisiaTurkeyTurkmenistanTurks and Caicos IslandsTuvaluUgandaUkraineUnited Arab EmiratesUnited KingdomUnited StatesUpper middle incomeUruguayUzbekistanVanuatuVenezuela, RBVietnamVirgin Islands (U.S.)West Bank and GazaWorldYemen, Rep.ZambiaZimbabwe Timeline:
This timeline shows a graph from 1961 to 2016 of Cote d'Ivoire. No data until 1960. Number of actual observations by date: 56.
Source name:
World Development Indicators
Source organization:
(1) United Nations Population Division. World Population Prospects, (2) Census reports and other statistical publications from national statistical offices, (3) Eurostat: Demographic Statistics, (4) United Nations Statistical Division. Population and Vital Statistics Report (various years), (5) U.S. Census Bureau: International Database, and (6) Secretariat of the Pacific Community: Statistics and Demography Programme.
Categories, topics:
Climate Change, Health
Last updated:
apr 23, 2017
Indicators value changes by year
Minimum:
3.475 mln
jan 1, 1961
Maximum:
22.702 mln
jan 1, 2016
At the date of observation
Value
Absolute change
Change from previous value
jan 1, 1961
3.475 mln
+3.475 mln
0.0%
jan 1, 1962
3.602 mln
+127.351K
3.67%
jan 1, 1963
3.741 mln
+138.428K
3.84%
jan 1, 1964
3.89 mln
+149.356K
3.99%
jan 1, 1965
4.05 mln
+159.816K
4.11%
jan 1, 1966
4.22 mln
+170.064K
4.2%
jan 1, 1967
4.4 mln
+180.315K
4.27%
jan 1, 1968
4.591 mln
+191.184K
4.35%
jan 1, 1969
4.794 mln
+203.161K
4.42%
jan 1, 1970
5.011 mln
+216.563K
4.52%
jan 1, 1971
5.242 mln
+230.952K
4.61%
jan 1, 1972
5.488 mln
+245.68K
4.69%
jan 1, 1973
5.748 mln
+260.039K
4.74%
jan 1, 1974
6.021 mln
+273.772K
4.76%
jan 1, 1975
6.308 mln
+286.531K
4.76%
jan 1, 1976
6.606 mln
+298.459K
4.73%
jan 1, 1977
6.916 mln
+309.907K
4.69%
jan 1, 1978
7.237 mln
+321.149K
4.64%
jan 1, 1979
7.57 mln
+332.107K
4.59%
jan 1, 1980
7.912 mln
+342.832K
4.53%
jan 1, 1981
8.266 mln
+353.159K
4.46%
jan 1, 1982
8.629 mln
+363.572K
4.4%
jan 1, 1983
9.002 mln
+373.279K
4.33%
jan 1, 1984
9.383 mln
+380.889K
4.23%
jan 1, 1985
9.769 mln
+385.816K
4.11%
jan 1, 1986
10.158 mln
+388.928K
3.98%
jan 1, 1987
10.548 mln
+390.115K
3.84%
jan 1, 1988
10.94 mln
+391.839K
3.71%
jan 1, 1989
11.337 mln
+397.135K
3.63%
jan 1, 1990
11.745 mln
+407.576K
3.6%
jan 1, 1991
12.166 mln
+421.211K
3.59%
jan 1, 1992
12.601 mln
+435.058K
3.58%
jan 1, 1993
13.047 mln
+445.94K
3.54%
jan 1, 1994
13.5 mln
+452.789K
3.47%
jan 1, 1995
13.954 mln
+454.083K
3.36%
jan 1, 1996
14.404 mln
+450.561K
3.23%
jan 1, 1997
14.852 mln
+447.853K
3.11%
jan 1, 1998
15.296 mln
+444.197K
2.99%
jan 1, 1999
15.728 mln
+432.092K
2.82%
jan 1, 2000
16.138 mln
+409.342K
2.6%
jan 1, 2001
16.518 mln
+380.124K
2.36%
jan 1, 2002
16.865 mln
+347.428K
2.1%
jan 1, 2003
17.185 mln
+320.045K
1.9%
jan 1, 2004
17.492 mln
+306.118K
1.78%
jan 1, 2005
17.803 mln
+310.977K
1.78%
jan 1, 2006
18.133 mln
+330.186K
1.85%
jan 1, 2007
18.486 mln
+353.69K
1.95%
jan 1, 2008
18.862 mln
+375.78K
2.03%
jan 1, 2009
19.262 mln
+399.475K
2.12%
jan 1, 2010
19.685 mln
+423.262K
2.2%
jan 1, 2011
20.132 mln
+446.798K
2.27%
jan 1, 2012
20.604 mln
+472.465K
2.35%
jan 1, 2013
21.103 mln
+498.469K
2.42%
jan 1, 2014
21.622 mln
+519.849K
2.46%
jan 1, 2015
22.157 mln
+534.617K
2.47%
jan 1, 2016
22.702 mln
+544.449K
2.46%
Ranking of countries by current statistics by years


Comments: