29
/
en
AIzaSyAYiBZKx7MnpbEhh9jyipgxe19OcubqV5w
April 1, 2024
81045
Belarus
BLR
true
2
1
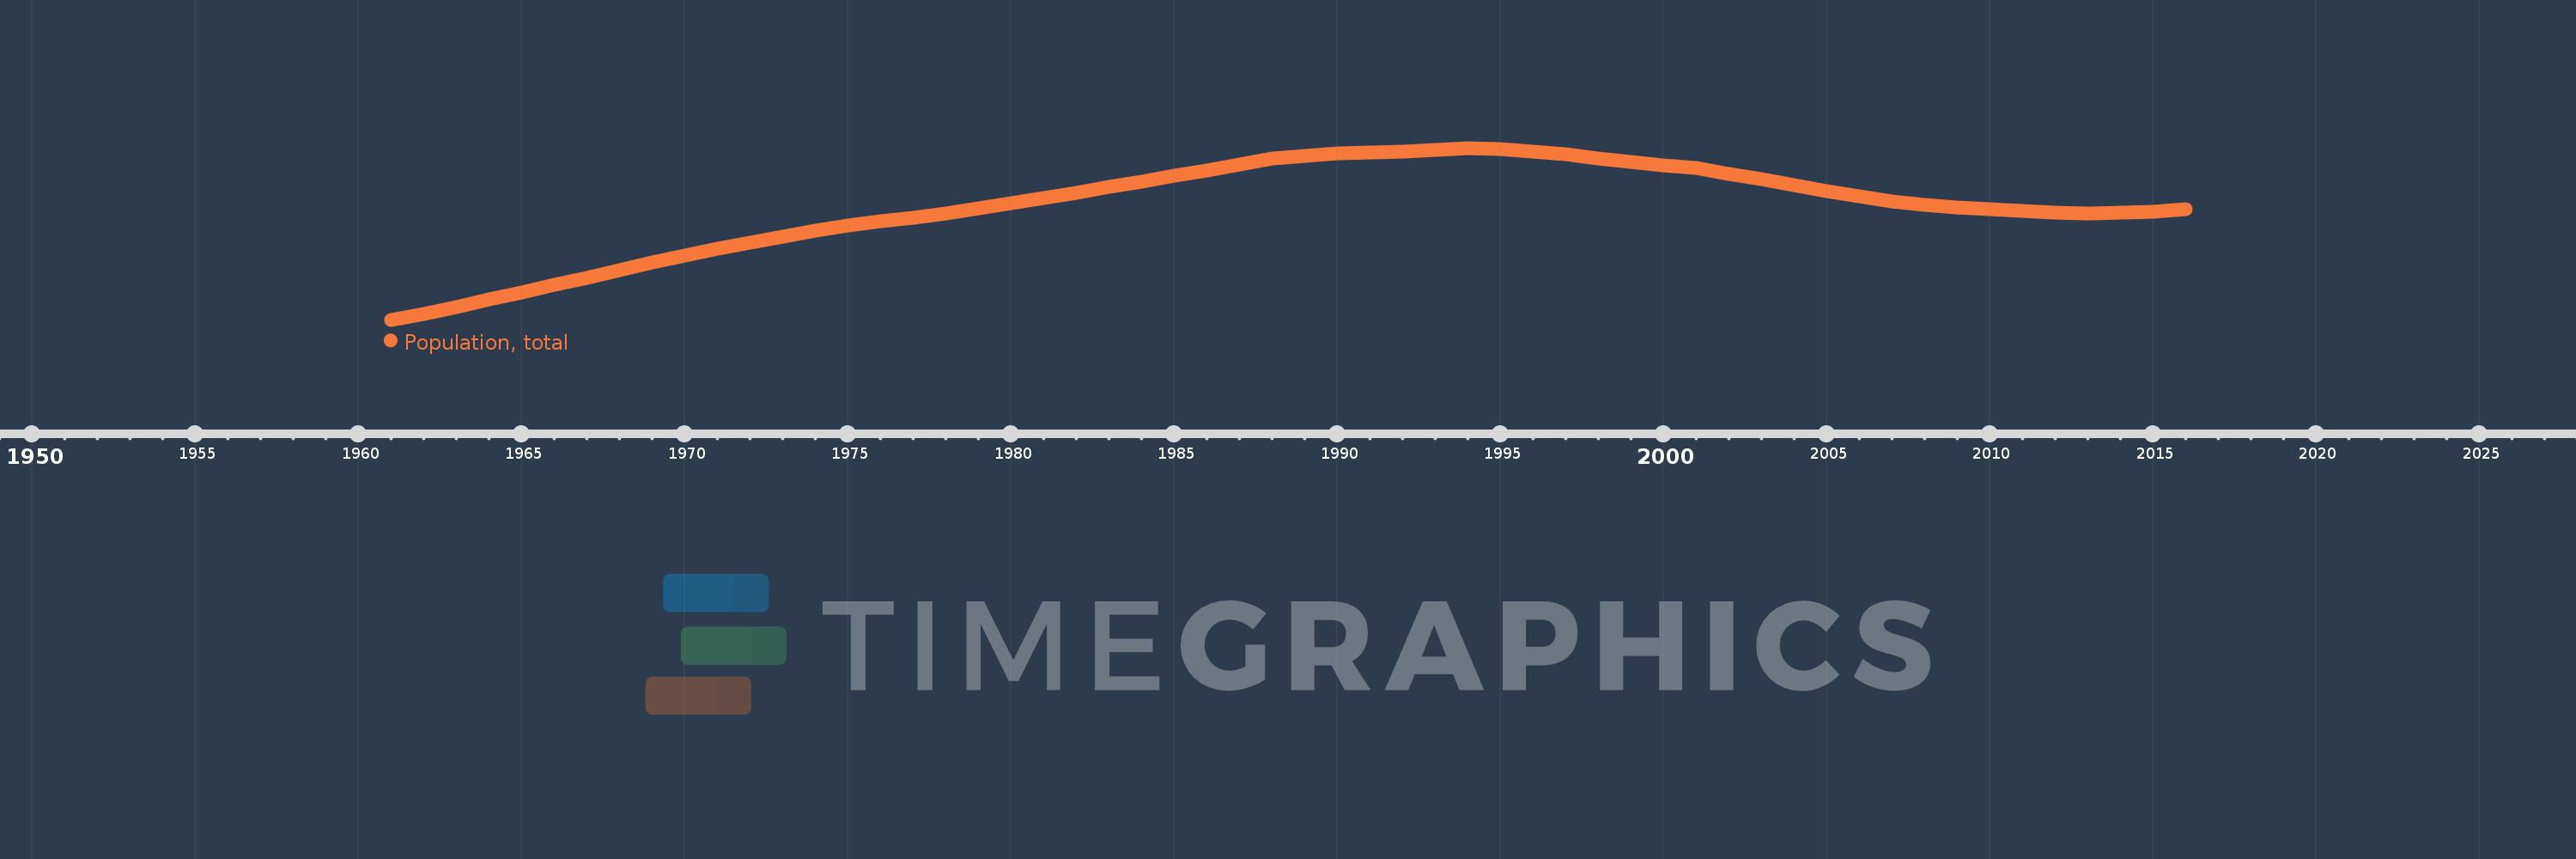
Population, total
2016,2015,2014,2013,2012,2011,2010,2009,2008,2007,2006,2005,2004,2003,2002,2001,2000,1999,1998,1997,1996,1995,1994,1993,1992,1991,1990,1989,1988,1987,1986,1985,1984,1983,1982,1981,1980,1979,1978,1977,1976,1975,1974,1973,1972,1971,1970,1969,1968,1967,1966,1965,1964,1963,1962,1961
This statistics in other country:
AfghanistanAlbaniaAlgeriaAmerican SamoaAndorraAngolaAntigua and BarbudaArab WorldArgentinaArmeniaArubaAustraliaAustriaAzerbaijanBahamas, TheBahrainBangladeshBarbadosBelarusBelgiumBelizeBeninBermudaBhutanBoliviaBosnia and HerzegovinaBotswanaBrazilBritish Virgin IslandsBrunei DarussalamBulgariaBurkina FasoBurundiCabo VerdeCambodiaCameroonCanadaCaribbean small statesCayman IslandsCentral African RepublicCentral Europe and the BalticsChadChannel IslandsChileChinaColombiaComorosCongo, Dem. Rep.Congo, Rep.Costa RicaCote d'IvoireCroatiaCubaCuracaoCyprusCzech RepublicDenmarkDjiboutiDominicaDominican RepublicEarly-demographic dividendEast Asia & PacificEast Asia & Pacific (excluding high income)East Asia & Pacific (IDA & IBRD countries)EcuadorEgypt, Arab Rep.El SalvadorEquatorial GuineaEritreaEstoniaEthiopiaEuro areaEurope & Central AsiaEurope & Central Asia (excluding high income)Europe & Central Asia (IDA & IBRD countries)European UnionFaroe IslandsFijiFinlandFragile and conflict affected situationsFranceFrench PolynesiaGabonGambia, TheGeorgiaGermanyGhanaGibraltarGreeceGreenlandGrenadaGuamGuatemalaGuineaGuinea-BissauGuyanaHaitiHeavily indebted poor countries (HIPC)High incomeHondurasHong Kong SAR, ChinaHungaryIBRD onlyIcelandIDA & IBRD totalIDA blendIDA onlyIDA totalIndiaIndonesiaIran, Islamic Rep.IraqIrelandIsle of ManIsraelItalyJamaicaJapanJordanKazakhstanKenyaKiribatiKorea, Dem. People’s Rep.Korea, Rep.KosovoKuwaitKyrgyz RepublicLao PDRLate-demographic dividendLatin America & Caribbean Latin America & Caribbean (excluding high income)Latin America & the Caribbean (IDA & IBRD countries)LatviaLeast developed countries: UN classificationLebanonLesothoLiberiaLibyaLiechtensteinLithuaniaLow & middle incomeLow incomeLower middle incomeLuxembourgMacao SAR, ChinaMacedonia, FYRMadagascarMalawiMalaysiaMaldivesMaliMaltaMarshall IslandsMauritaniaMauritiusMexicoMicronesia, Fed. Sts.Middle East & North AfricaMiddle East & North Africa (excluding high income)Middle East & North Africa (IDA & IBRD countries)Middle incomeMoldovaMonacoMongoliaMontenegroMoroccoMozambiqueMyanmarNamibiaNauruNepalNetherlandsNew CaledoniaNew ZealandNicaraguaNigerNigeriaNorth AmericaNorthern Mariana IslandsNorwayOECD membersOmanOther small statesPacific island small statesPakistanPalauPanamaPapua New GuineaParaguayPeruPhilippinesPolandPortugalPost-demographic dividendPre-demographic dividendPuerto RicoQatarRomaniaRussian FederationRwandaSamoaSan MarinoSao Tome and PrincipeSaudi ArabiaSenegalSerbiaSeychellesSierra LeoneSingaporeSint Maarten (Dutch part)Slovak RepublicSloveniaSmall statesSolomon IslandsSomaliaSouth AfricaSouth AsiaSouth Asia (IDA & IBRD)South SudanSpainSri LankaSt. Kitts and NevisSt. LuciaSt. Martin (French part)St. Vincent and the GrenadinesSub-Saharan Africa Sub-Saharan Africa (excluding high income)Sub-Saharan Africa (IDA & IBRD countries)SudanSurinameSwazilandSwedenSwitzerlandSyrian Arab RepublicTajikistanTanzaniaThailandTimor-LesteTogoTongaTrinidad and TobagoTunisiaTurkeyTurkmenistanTurks and Caicos IslandsTuvaluUgandaUkraineUnited Arab EmiratesUnited KingdomUnited StatesUpper middle incomeUruguayUzbekistanVanuatuVenezuela, RBVietnamVirgin Islands (U.S.)West Bank and GazaWorldYemen, Rep.ZambiaZimbabwe Timeline:
This timeline shows a graph from 1961 to 2016 of Belarus. No data until 1960. Number of actual observations by date: 56.
Source name:
World Development Indicators
Source organization:
(1) United Nations Population Division. World Population Prospects, (2) Census reports and other statistical publications from national statistical offices, (3) Eurostat: Demographic Statistics, (4) United Nations Statistical Division. Population and Vital Statistics Report (various years), (5) U.S. Census Bureau: International Database, and (6) Secretariat of the Pacific Community: Statistics and Demography Programme.
Categories, topics:
Climate Change, Health
Last updated:
apr 23, 2017
Indicators value changes by year
Minimum:
8.198 mln
jan 1, 1961
Maximum:
10.239 mln
jan 1, 1994
At the date of observation
Value
Absolute change
Change from previous value
jan 1, 1961
8.198 mln
+8.198 mln
0.0%
jan 1, 1962
8.271 mln
+73.216K
0.89%
jan 1, 1963
8.352 mln
+80.712K
0.98%
jan 1, 1964
8.437 mln
+85.304K
1.02%
jan 1, 1965
8.524 mln
+86.992K
1.03%
jan 1, 1966
8.61 mln
+85.776K
1.01%
jan 1, 1967
8.696 mln
+86.496K
1.0%
jan 1, 1968
8.786 mln
+89.152K
1.03%
jan 1, 1969
8.875 mln
+88.904K
1.01%
jan 1, 1970
8.96 mln
+85.752K
0.97%
jan 1, 1971
9.04 mln
+79.696K
0.89%
jan 1, 1972
9.116 mln
+75.576K
0.84%
jan 1, 1973
9.189 mln
+73.392K
0.81%
jan 1, 1974
9.257 mln
+68.304K
0.74%
jan 1, 1975
9.318 mln
+60.312K
0.65%
jan 1, 1976
9.367 mln
+49.416K
0.53%
jan 1, 1977
9.411 mln
+44.0K
0.47%
jan 1, 1978
9.463 mln
+52.0K
0.55%
jan 1, 1979
9.525 mln
+62.0K
0.66%
jan 1, 1980
9.584 mln
+59.0K
0.62%
jan 1, 1981
9.643 mln
+59.0K
0.62%
jan 1, 1982
9.71 mln
+67.0K
0.69%
jan 1, 1983
9.776 mln
+66.0K
0.68%
jan 1, 1984
9.843 mln
+67.0K
0.69%
jan 1, 1985
9.91 mln
+67.0K
0.68%
jan 1, 1986
9.975 mln
+65.0K
0.66%
jan 1, 1987
10.043 mln
+68.0K
0.68%
jan 1, 1988
10.111 mln
+68.0K
0.68%
jan 1, 1989
10.14 mln
+29.0K
0.29%
jan 1, 1990
10.17 mln
+30.0K
0.3%
jan 1, 1991
10.189 mln
+19.0K
0.19%
jan 1, 1992
10.194 mln
+5.0K
0.05%
jan 1, 1993
10.216 mln
+22.0K
0.22%
jan 1, 1994
10.239 mln
+23.0K
0.23%
jan 1, 1995
10.227 mln
-12.0K
-0.12%
jan 1, 1996
10.194 mln
-33.0K
-0.32%
jan 1, 1997
10.16 mln
-34.0K
-0.33%
jan 1, 1998
10.117 mln
-43.0K
-0.42%
jan 1, 1999
10.069 mln
-48.0K
-0.47%
jan 1, 2000
10.035 mln
-34.0K
-0.34%
jan 1, 2001
10.005 mln
-30.0K
-0.3%
jan 1, 2002
9.928 mln
-77.0K
-0.77%
jan 1, 2003
9.865 mln
-63.0K
-0.63%
jan 1, 2004
9.797 mln
-68.0K
-0.69%
jan 1, 2005
9.73 mln
-67.0K
-0.68%
jan 1, 2006
9.663 mln
-67.0K
-0.69%
jan 1, 2007
9.604 mln
-59.0K
-0.61%
jan 1, 2008
9.56 mln
-44.0K
-0.46%
jan 1, 2009
9.528 mln
-32.0K
-0.33%
jan 1, 2010
9.507 mln
-21.0K
-0.22%
jan 1, 2011
9.49 mln
-17.0K
-0.18%
jan 1, 2012
9.473 mln
-17.0K
-0.18%
jan 1, 2013
9.464 mln
-9.0K
-0.1%
jan 1, 2014
9.466 mln
+2.0K
0.02%
jan 1, 2015
9.483 mln
+17.0K
0.18%
jan 1, 2016
9.513 mln
+30.0K
0.32%
Ranking of countries by current statistics by years


Comments: