29
/
en
AIzaSyAYiBZKx7MnpbEhh9jyipgxe19OcubqV5w
April 1, 2024
43797
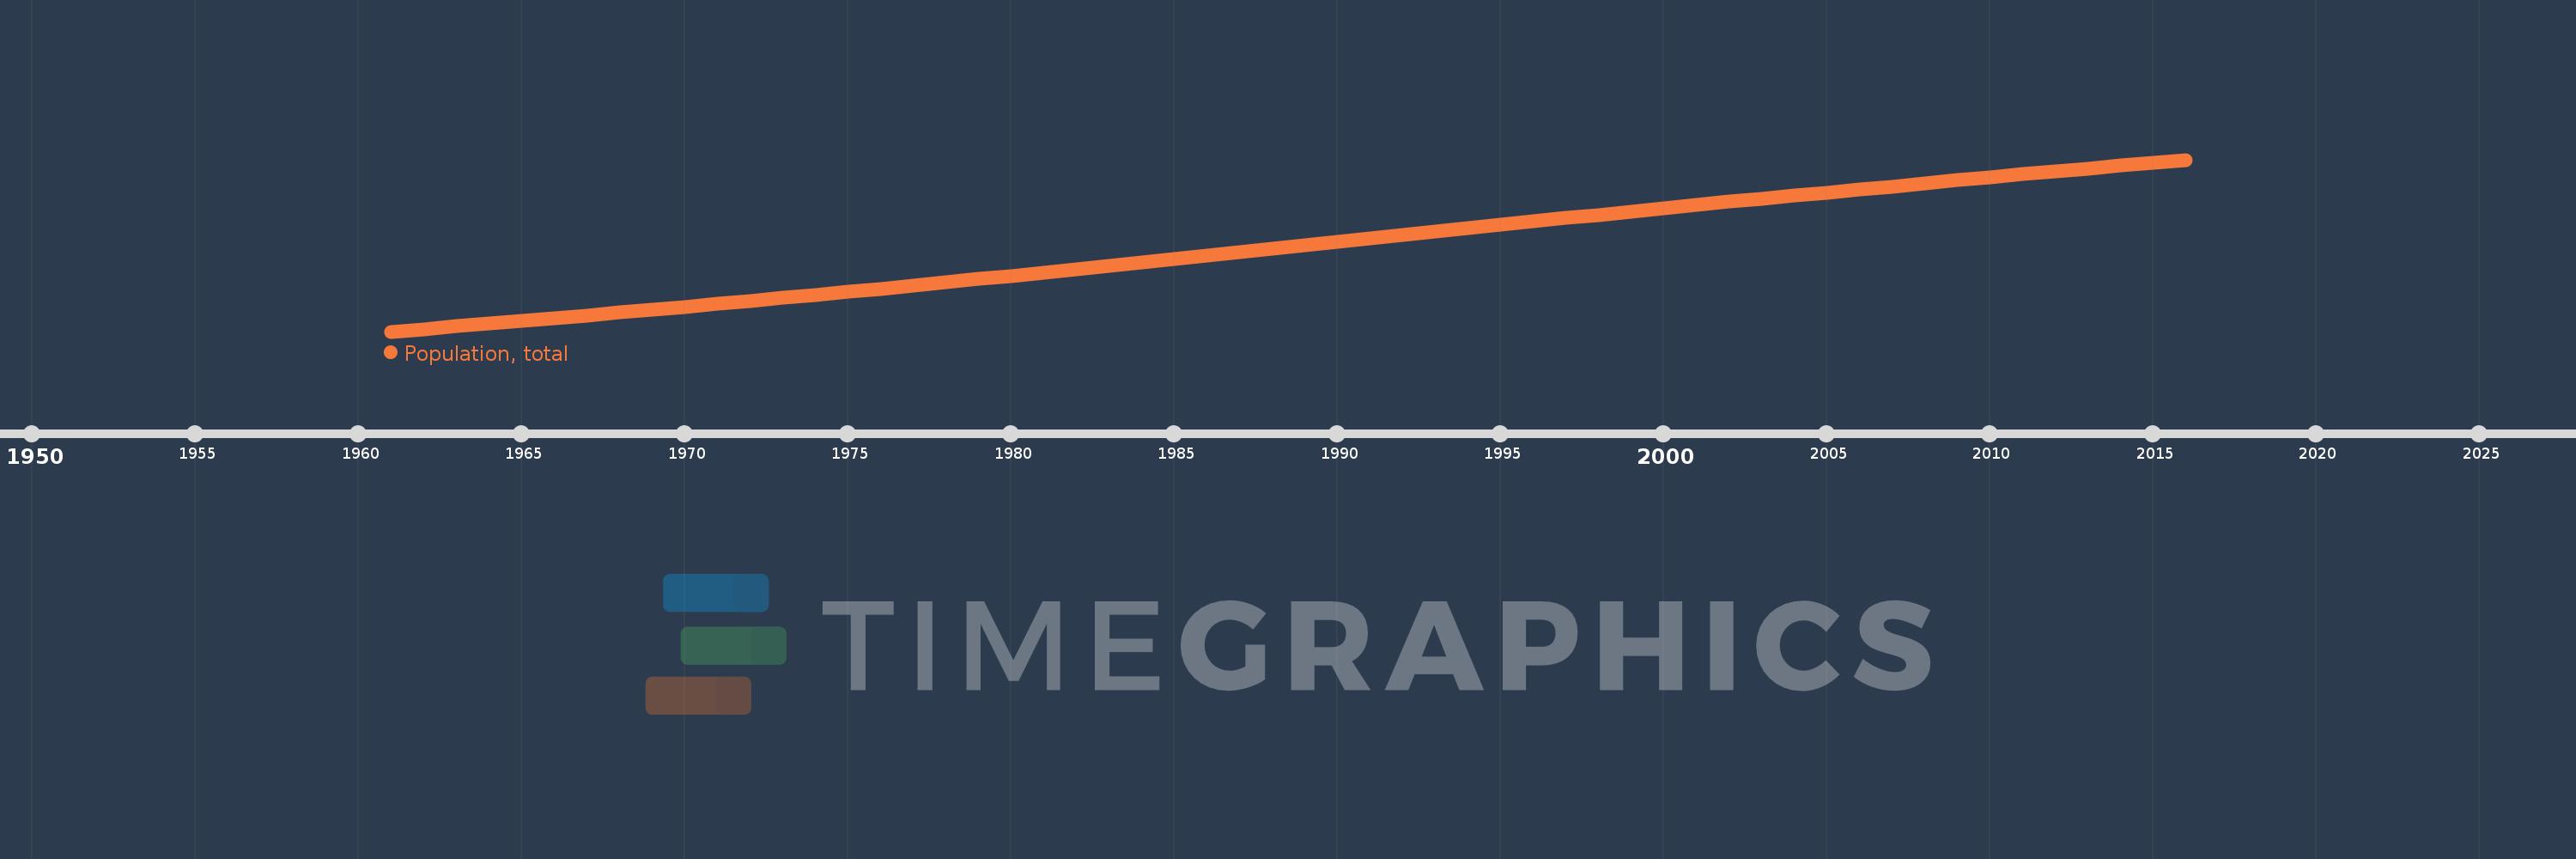
Latin America & the Caribbean (IDA & IBRD countries)
TLA
false
2
1
Population, total
2016,2015,2014,2013,2012,2011,2010,2009,2008,2007,2006,2005,2004,2003,2002,2001,2000,1999,1998,1997,1996,1995,1994,1993,1992,1991,1990,1989,1988,1987,1986,1985,1984,1983,1982,1981,1980,1979,1978,1977,1976,1975,1974,1973,1972,1971,1970,1969,1968,1967,1966,1965,1964,1963,1962,1961
This statistics in other country:
AfghanistanAlbaniaAlgeriaAmerican SamoaAndorraAngolaAntigua and BarbudaArab WorldArgentinaArmeniaArubaAustraliaAustriaAzerbaijanBahamas, TheBahrainBangladeshBarbadosBelarusBelgiumBelizeBeninBermudaBhutanBoliviaBosnia and HerzegovinaBotswanaBrazilBritish Virgin IslandsBrunei DarussalamBulgariaBurkina FasoBurundiCabo VerdeCambodiaCameroonCanadaCaribbean small statesCayman IslandsCentral African RepublicCentral Europe and the BalticsChadChannel IslandsChileChinaColombiaComorosCongo, Dem. Rep.Congo, Rep.Costa RicaCote d'IvoireCroatiaCubaCuracaoCyprusCzech RepublicDenmarkDjiboutiDominicaDominican RepublicEarly-demographic dividendEast Asia & PacificEast Asia & Pacific (excluding high income)East Asia & Pacific (IDA & IBRD countries)EcuadorEgypt, Arab Rep.El SalvadorEquatorial GuineaEritreaEstoniaEthiopiaEuro areaEurope & Central AsiaEurope & Central Asia (excluding high income)Europe & Central Asia (IDA & IBRD countries)European UnionFaroe IslandsFijiFinlandFragile and conflict affected situationsFranceFrench PolynesiaGabonGambia, TheGeorgiaGermanyGhanaGibraltarGreeceGreenlandGrenadaGuamGuatemalaGuineaGuinea-BissauGuyanaHaitiHeavily indebted poor countries (HIPC)High incomeHondurasHong Kong SAR, ChinaHungaryIBRD onlyIcelandIDA & IBRD totalIDA blendIDA onlyIDA totalIndiaIndonesiaIran, Islamic Rep.IraqIrelandIsle of ManIsraelItalyJamaicaJapanJordanKazakhstanKenyaKiribatiKorea, Dem. People’s Rep.Korea, Rep.KosovoKuwaitKyrgyz RepublicLao PDRLate-demographic dividendLatin America & Caribbean Latin America & Caribbean (excluding high income)Latin America & the Caribbean (IDA & IBRD countries)LatviaLeast developed countries: UN classificationLebanonLesothoLiberiaLibyaLiechtensteinLithuaniaLow & middle incomeLow incomeLower middle incomeLuxembourgMacao SAR, ChinaMacedonia, FYRMadagascarMalawiMalaysiaMaldivesMaliMaltaMarshall IslandsMauritaniaMauritiusMexicoMicronesia, Fed. Sts.Middle East & North AfricaMiddle East & North Africa (excluding high income)Middle East & North Africa (IDA & IBRD countries)Middle incomeMoldovaMonacoMongoliaMontenegroMoroccoMozambiqueMyanmarNamibiaNauruNepalNetherlandsNew CaledoniaNew ZealandNicaraguaNigerNigeriaNorth AmericaNorthern Mariana IslandsNorwayOECD membersOmanOther small statesPacific island small statesPakistanPalauPanamaPapua New GuineaParaguayPeruPhilippinesPolandPortugalPost-demographic dividendPre-demographic dividendPuerto RicoQatarRomaniaRussian FederationRwandaSamoaSan MarinoSao Tome and PrincipeSaudi ArabiaSenegalSerbiaSeychellesSierra LeoneSingaporeSint Maarten (Dutch part)Slovak RepublicSloveniaSmall statesSolomon IslandsSomaliaSouth AfricaSouth AsiaSouth Asia (IDA & IBRD)South SudanSpainSri LankaSt. Kitts and NevisSt. LuciaSt. Martin (French part)St. Vincent and the GrenadinesSub-Saharan Africa Sub-Saharan Africa (excluding high income)Sub-Saharan Africa (IDA & IBRD countries)SudanSurinameSwazilandSwedenSwitzerlandSyrian Arab RepublicTajikistanTanzaniaThailandTimor-LesteTogoTongaTrinidad and TobagoTunisiaTurkeyTurkmenistanTurks and Caicos IslandsTuvaluUgandaUkraineUnited Arab EmiratesUnited KingdomUnited StatesUpper middle incomeUruguayUzbekistanVanuatuVenezuela, RBVietnamVirgin Islands (U.S.)West Bank and GazaWorldYemen, Rep.ZambiaZimbabwe Timeline:
This timeline shows a graph from 1961 to 2016 of Latin America & the Caribbean (IDA & IBRD countries). No data until 1960. Number of actual observations by date: 56.
Source name:
World Development Indicators
Source organization:
(1) United Nations Population Division. World Population Prospects, (2) Census reports and other statistical publications from national statistical offices, (3) Eurostat: Demographic Statistics, (4) United Nations Statistical Division. Population and Vital Statistics Report (various years), (5) U.S. Census Bureau: International Database, and (6) Secretariat of the Pacific Community: Statistics and Demography Programme.
Categories, topics:
Climate Change, Health
Last updated:
apr 23, 2017
Indicators value changes by year
Minimum:
210.496 mln
jan 1, 1961
Maximum:
616.863 mln
jan 1, 2016
At the date of observation
Value
Absolute change
Change from previous value
jan 1, 1961
210.496 mln
+210.496 mln
0.0%
jan 1, 1962
216.494 mln
+5.998 mln
2.85%
jan 1, 1963
222.689 mln
+6.195 mln
2.86%
jan 1, 1964
229.042 mln
+6.353 mln
2.85%
jan 1, 1965
235.499 mln
+6.456 mln
2.82%
jan 1, 1966
242.018 mln
+6.52 mln
2.77%
jan 1, 1967
248.587 mln
+6.568 mln
2.71%
jan 1, 1968
255.212 mln
+6.625 mln
2.67%
jan 1, 1969
261.911 mln
+6.699 mln
2.62%
jan 1, 1970
268.712 mln
+6.801 mln
2.6%
jan 1, 1971
275.635 mln
+6.923 mln
2.58%
jan 1, 1972
282.681 mln
+7.046 mln
2.56%
jan 1, 1973
289.842 mln
+7.16 mln
2.53%
jan 1, 1974
297.109 mln
+7.267 mln
2.51%
jan 1, 1975
304.472 mln
+7.364 mln
2.48%
jan 1, 1976
311.924 mln
+7.451 mln
2.45%
jan 1, 1977
319.457 mln
+7.533 mln
2.42%
jan 1, 1978
327.07 mln
+7.613 mln
2.38%
jan 1, 1979
334.766 mln
+7.696 mln
2.35%
jan 1, 1980
342.552 mln
+7.786 mln
2.33%
jan 1, 1981
350.431 mln
+7.879 mln
2.3%
jan 1, 1982
358.395 mln
+7.965 mln
2.27%
jan 1, 1983
366.442 mln
+8.047 mln
2.25%
jan 1, 1984
374.542 mln
+8.1 mln
2.21%
jan 1, 1985
382.66 mln
+8.118 mln
2.17%
jan 1, 1986
390.766 mln
+8.106 mln
2.12%
jan 1, 1987
398.849 mln
+8.083 mln
2.07%
jan 1, 1988
406.906 mln
+8.057 mln
2.02%
jan 1, 1989
414.936 mln
+8.031 mln
1.97%
jan 1, 1990
422.967 mln
+8.031 mln
1.94%
jan 1, 1991
430.984 mln
+8.017 mln
1.9%
jan 1, 1992
438.984 mln
+8.0 mln
1.86%
jan 1, 1993
446.961 mln
+7.976 mln
1.82%
jan 1, 1994
454.917 mln
+7.957 mln
1.78%
jan 1, 1995
462.862 mln
+7.944 mln
1.75%
jan 1, 1996
470.796 mln
+7.935 mln
1.71%
jan 1, 1997
478.735 mln
+7.939 mln
1.69%
jan 1, 1998
486.652 mln
+7.917 mln
1.65%
jan 1, 1999
494.519 mln
+7.867 mln
1.62%
jan 1, 2000
502.29 mln
+7.771 mln
1.57%
jan 1, 2001
509.939 mln
+7.649 mln
1.52%
jan 1, 2002
517.453 mln
+7.514 mln
1.47%
jan 1, 2003
524.837 mln
+7.384 mln
1.43%
jan 1, 2004
532.129 mln
+7.292 mln
1.39%
jan 1, 2005
539.376 mln
+7.247 mln
1.36%
jan 1, 2006
546.612 mln
+7.236 mln
1.34%
jan 1, 2007
553.845 mln
+7.233 mln
1.32%
jan 1, 2008
561.062 mln
+7.217 mln
1.3%
jan 1, 2009
568.252 mln
+7.191 mln
1.28%
jan 1, 2010
575.398 mln
+7.146 mln
1.26%
jan 1, 2011
582.484 mln
+7.086 mln
1.23%
jan 1, 2012
589.506 mln
+7.022 mln
1.21%
jan 1, 2013
596.463 mln
+6.957 mln
1.18%
jan 1, 2014
603.348 mln
+6.884 mln
1.15%
jan 1, 2015
610.15 mln
+6.802 mln
1.13%
jan 1, 2016
616.863 mln
+6.713 mln
1.1%
Ranking of countries by current statistics by years


Comments: