29
/
en
AIzaSyAYiBZKx7MnpbEhh9jyipgxe19OcubqV5w
April 1, 2024
30216
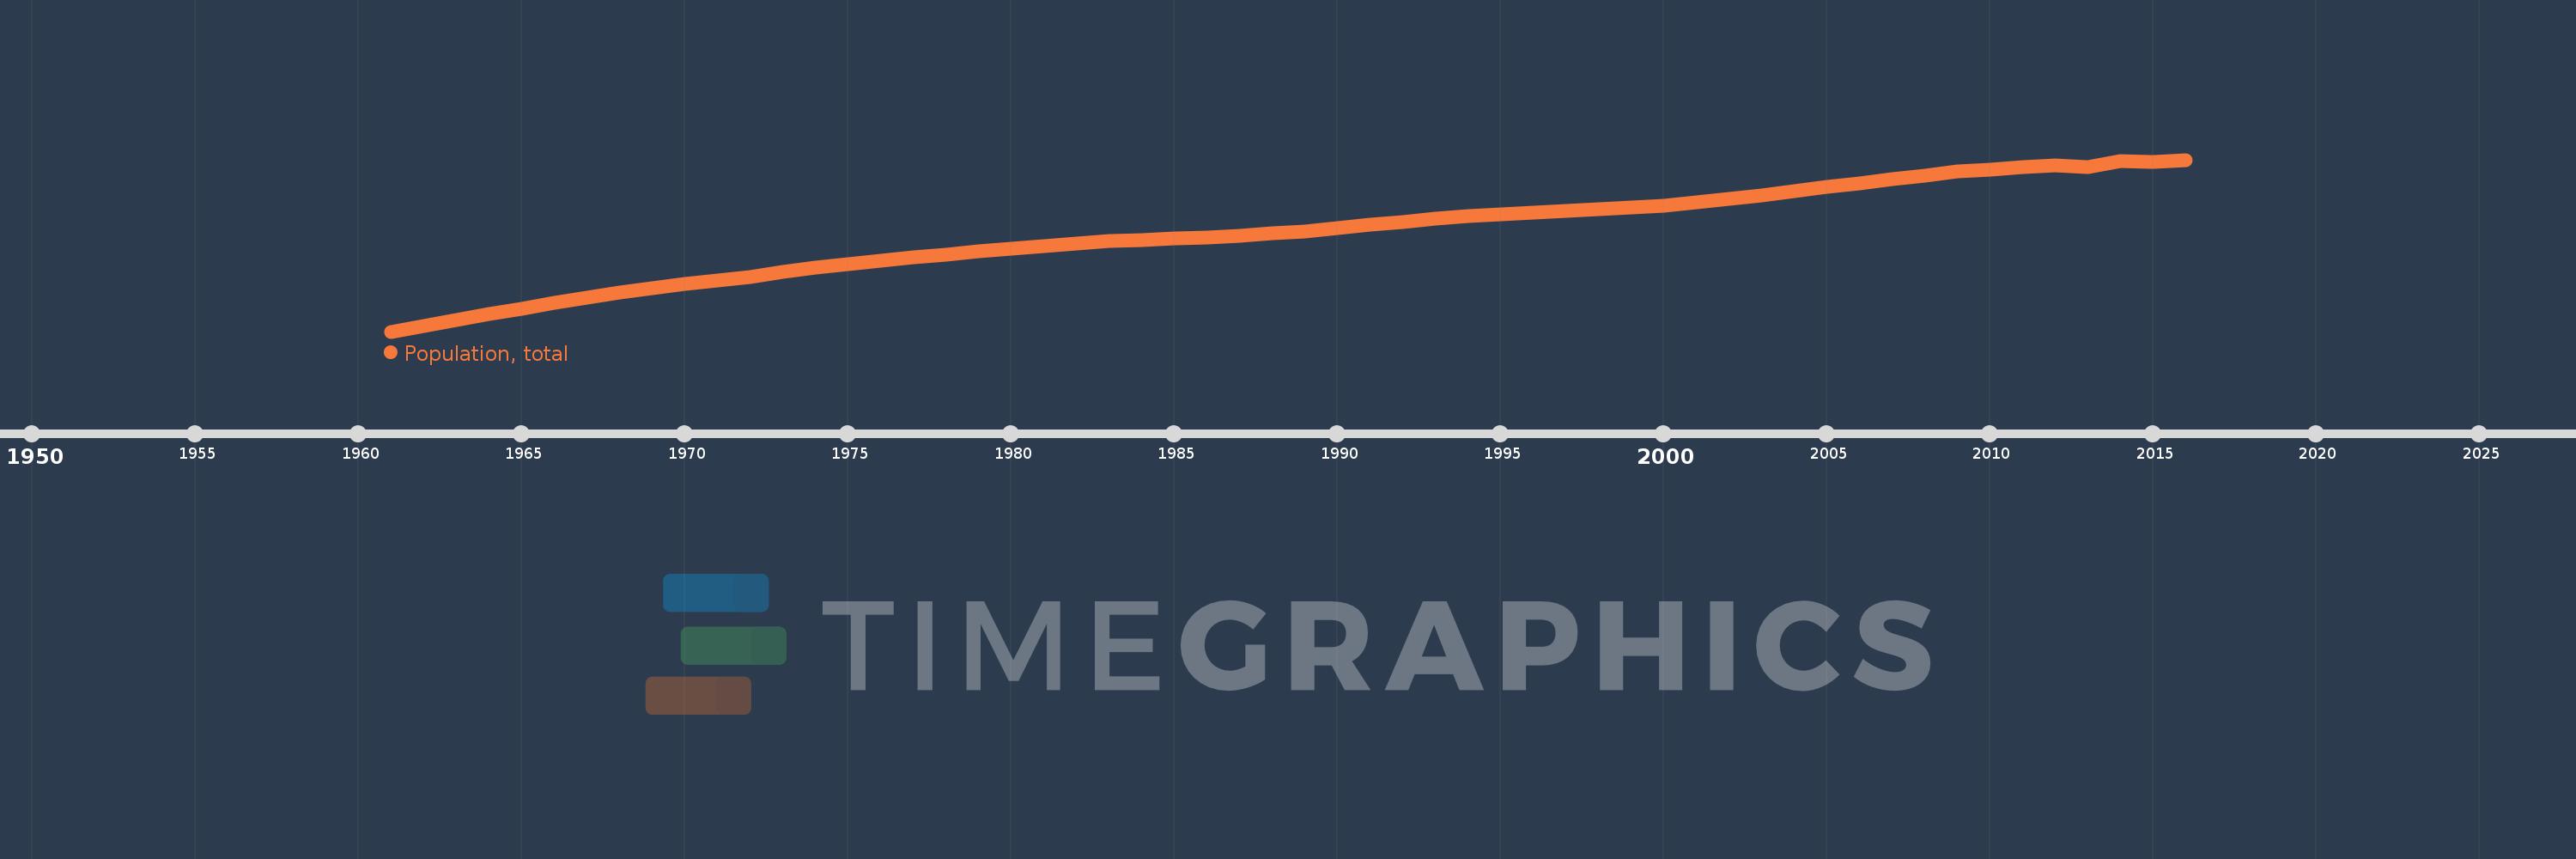
Euro area
EMU
false
2
1
Population, total
2016,2015,2014,2013,2012,2011,2010,2009,2008,2007,2006,2005,2004,2003,2002,2001,2000,1999,1998,1997,1996,1995,1994,1993,1992,1991,1990,1989,1988,1987,1986,1985,1984,1983,1982,1981,1980,1979,1978,1977,1976,1975,1974,1973,1972,1971,1970,1969,1968,1967,1966,1965,1964,1963,1962,1961
This statistics in other country:
AfghanistanAlbaniaAlgeriaAmerican SamoaAndorraAngolaAntigua and BarbudaArab WorldArgentinaArmeniaArubaAustraliaAustriaAzerbaijanBahamas, TheBahrainBangladeshBarbadosBelarusBelgiumBelizeBeninBermudaBhutanBoliviaBosnia and HerzegovinaBotswanaBrazilBritish Virgin IslandsBrunei DarussalamBulgariaBurkina FasoBurundiCabo VerdeCambodiaCameroonCanadaCaribbean small statesCayman IslandsCentral African RepublicCentral Europe and the BalticsChadChannel IslandsChileChinaColombiaComorosCongo, Dem. Rep.Congo, Rep.Costa RicaCote d'IvoireCroatiaCubaCuracaoCyprusCzech RepublicDenmarkDjiboutiDominicaDominican RepublicEarly-demographic dividendEast Asia & PacificEast Asia & Pacific (excluding high income)East Asia & Pacific (IDA & IBRD countries)EcuadorEgypt, Arab Rep.El SalvadorEquatorial GuineaEritreaEstoniaEthiopiaEuro areaEurope & Central AsiaEurope & Central Asia (excluding high income)Europe & Central Asia (IDA & IBRD countries)European UnionFaroe IslandsFijiFinlandFragile and conflict affected situationsFranceFrench PolynesiaGabonGambia, TheGeorgiaGermanyGhanaGibraltarGreeceGreenlandGrenadaGuamGuatemalaGuineaGuinea-BissauGuyanaHaitiHeavily indebted poor countries (HIPC)High incomeHondurasHong Kong SAR, ChinaHungaryIBRD onlyIcelandIDA & IBRD totalIDA blendIDA onlyIDA totalIndiaIndonesiaIran, Islamic Rep.IraqIrelandIsle of ManIsraelItalyJamaicaJapanJordanKazakhstanKenyaKiribatiKorea, Dem. People’s Rep.Korea, Rep.KosovoKuwaitKyrgyz RepublicLao PDRLate-demographic dividendLatin America & Caribbean Latin America & Caribbean (excluding high income)Latin America & the Caribbean (IDA & IBRD countries)LatviaLeast developed countries: UN classificationLebanonLesothoLiberiaLibyaLiechtensteinLithuaniaLow & middle incomeLow incomeLower middle incomeLuxembourgMacao SAR, ChinaMacedonia, FYRMadagascarMalawiMalaysiaMaldivesMaliMaltaMarshall IslandsMauritaniaMauritiusMexicoMicronesia, Fed. Sts.Middle East & North AfricaMiddle East & North Africa (excluding high income)Middle East & North Africa (IDA & IBRD countries)Middle incomeMoldovaMonacoMongoliaMontenegroMoroccoMozambiqueMyanmarNamibiaNauruNepalNetherlandsNew CaledoniaNew ZealandNicaraguaNigerNigeriaNorth AmericaNorthern Mariana IslandsNorwayOECD membersOmanOther small statesPacific island small statesPakistanPalauPanamaPapua New GuineaParaguayPeruPhilippinesPolandPortugalPost-demographic dividendPre-demographic dividendPuerto RicoQatarRomaniaRussian FederationRwandaSamoaSan MarinoSao Tome and PrincipeSaudi ArabiaSenegalSerbiaSeychellesSierra LeoneSingaporeSint Maarten (Dutch part)Slovak RepublicSloveniaSmall statesSolomon IslandsSomaliaSouth AfricaSouth AsiaSouth Asia (IDA & IBRD)South SudanSpainSri LankaSt. Kitts and NevisSt. LuciaSt. Martin (French part)St. Vincent and the GrenadinesSub-Saharan Africa Sub-Saharan Africa (excluding high income)Sub-Saharan Africa (IDA & IBRD countries)SudanSurinameSwazilandSwedenSwitzerlandSyrian Arab RepublicTajikistanTanzaniaThailandTimor-LesteTogoTongaTrinidad and TobagoTunisiaTurkeyTurkmenistanTurks and Caicos IslandsTuvaluUgandaUkraineUnited Arab EmiratesUnited KingdomUnited StatesUpper middle incomeUruguayUzbekistanVanuatuVenezuela, RBVietnamVirgin Islands (U.S.)West Bank and GazaWorldYemen, Rep.ZambiaZimbabwe Timeline:
This timeline shows a graph from 1961 to 2016 of Euro area. No data until 1960. Number of actual observations by date: 56.
Source name:
World Development Indicators
Source organization:
(1) United Nations Population Division. World Population Prospects, (2) Census reports and other statistical publications from national statistical offices, (3) Eurostat: Demographic Statistics, (4) United Nations Statistical Division. Population and Vital Statistics Report (various years), (5) U.S. Census Bureau: International Database, and (6) Secretariat of the Pacific Community: Statistics and Demography Programme.
Categories, topics:
Climate Change, Health
Last updated:
apr 23, 2017
Indicators value changes by year
Minimum:
265.397 mln
jan 1, 1961
Maximum:
339.425 mln
jan 1, 2016
At the date of observation
Value
Absolute change
Change from previous value
jan 1, 1961
265.397 mln
+265.397 mln
0.0%
jan 1, 1962
267.825 mln
+2.429 mln
0.92%
jan 1, 1963
270.325 mln
+2.5 mln
0.93%
jan 1, 1964
272.876 mln
+2.552 mln
0.94%
jan 1, 1965
275.382 mln
+2.506 mln
0.92%
jan 1, 1966
277.857 mln
+2.475 mln
0.9%
jan 1, 1967
280.147 mln
+2.291 mln
0.82%
jan 1, 1968
282.115 mln
+1.967 mln
0.7%
jan 1, 1969
283.967 mln
+1.852 mln
0.66%
jan 1, 1970
285.855 mln
+1.888 mln
0.66%
jan 1, 1971
287.416 mln
+1.561 mln
0.55%
jan 1, 1972
289.0 mln
+1.583 mln
0.55%
jan 1, 1973
290.939 mln
+1.939 mln
0.67%
jan 1, 1974
292.79 mln
+1.851 mln
0.64%
jan 1, 1975
294.47 mln
+1.681 mln
0.57%
jan 1, 1976
296.018 mln
+1.547 mln
0.53%
jan 1, 1977
297.375 mln
+1.357 mln
0.46%
jan 1, 1978
298.597 mln
+1.222 mln
0.41%
jan 1, 1979
299.917 mln
+1.32 mln
0.44%
jan 1, 1980
301.11 mln
+1.193 mln
0.4%
jan 1, 1981
302.311 mln
+1.202 mln
0.4%
jan 1, 1982
303.481 mln
+1.169 mln
0.39%
jan 1, 1983
304.271 mln
+790.248K
0.26%
jan 1, 1984
304.871 mln
+600.072K
0.2%
jan 1, 1985
305.38 mln
+509.543K
0.17%
jan 1, 1986
305.968 mln
+587.579K
0.19%
jan 1, 1987
306.748 mln
+780.169K
0.25%
jan 1, 1988
307.614 mln
+866.128K
0.28%
jan 1, 1989
308.675 mln
+1.06 mln
0.34%
jan 1, 1990
310.044 mln
+1.369 mln
0.44%
jan 1, 1991
311.523 mln
+1.479 mln
0.48%
jan 1, 1992
312.675 mln
+1.152 mln
0.37%
jan 1, 1993
314.066 mln
+1.391 mln
0.44%
jan 1, 1994
315.271 mln
+1.205 mln
0.38%
jan 1, 1995
316.106 mln
+835.141K
0.26%
jan 1, 1996
316.837 mln
+731.596K
0.23%
jan 1, 1997
317.584 mln
+746.516K
0.24%
jan 1, 1998
318.279 mln
+694.816K
0.22%
jan 1, 1999
318.923 mln
+644.382K
0.2%
jan 1, 2000
319.78 mln
+856.741K
0.27%
jan 1, 2001
320.997 mln
+1.218 mln
0.38%
jan 1, 2002
322.455 mln
+1.457 mln
0.45%
jan 1, 2003
324.128 mln
+1.674 mln
0.52%
jan 1, 2004
325.891 mln
+1.762 mln
0.54%
jan 1, 2005
327.688 mln
+1.797 mln
0.55%
jan 1, 2006
329.385 mln
+1.697 mln
0.52%
jan 1, 2007
330.926 mln
+1.54 mln
0.47%
jan 1, 2008
332.644 mln
+1.719 mln
0.52%
jan 1, 2009
334.27 mln
+1.626 mln
0.49%
jan 1, 2010
335.353 mln
+1.083 mln
0.32%
jan 1, 2011
336.143 mln
+789.26K
0.24%
jan 1, 2012
336.94 mln
+797.773K
0.24%
jan 1, 2013
336.162 mln
-778.793K
-0.23%
jan 1, 2014
338.755 mln
+2.594 mln
0.77%
jan 1, 2015
338.617 mln
-138.17K
-0.04%
jan 1, 2016
339.425 mln
+807.939K
0.24%
Ranking of countries by current statistics by years


Comments: