29
/
en
AIzaSyAYiBZKx7MnpbEhh9jyipgxe19OcubqV5w
April 1, 2024
32979
Europe & Central Asia (IDA & IBRD countries)
TEC
false
2
1
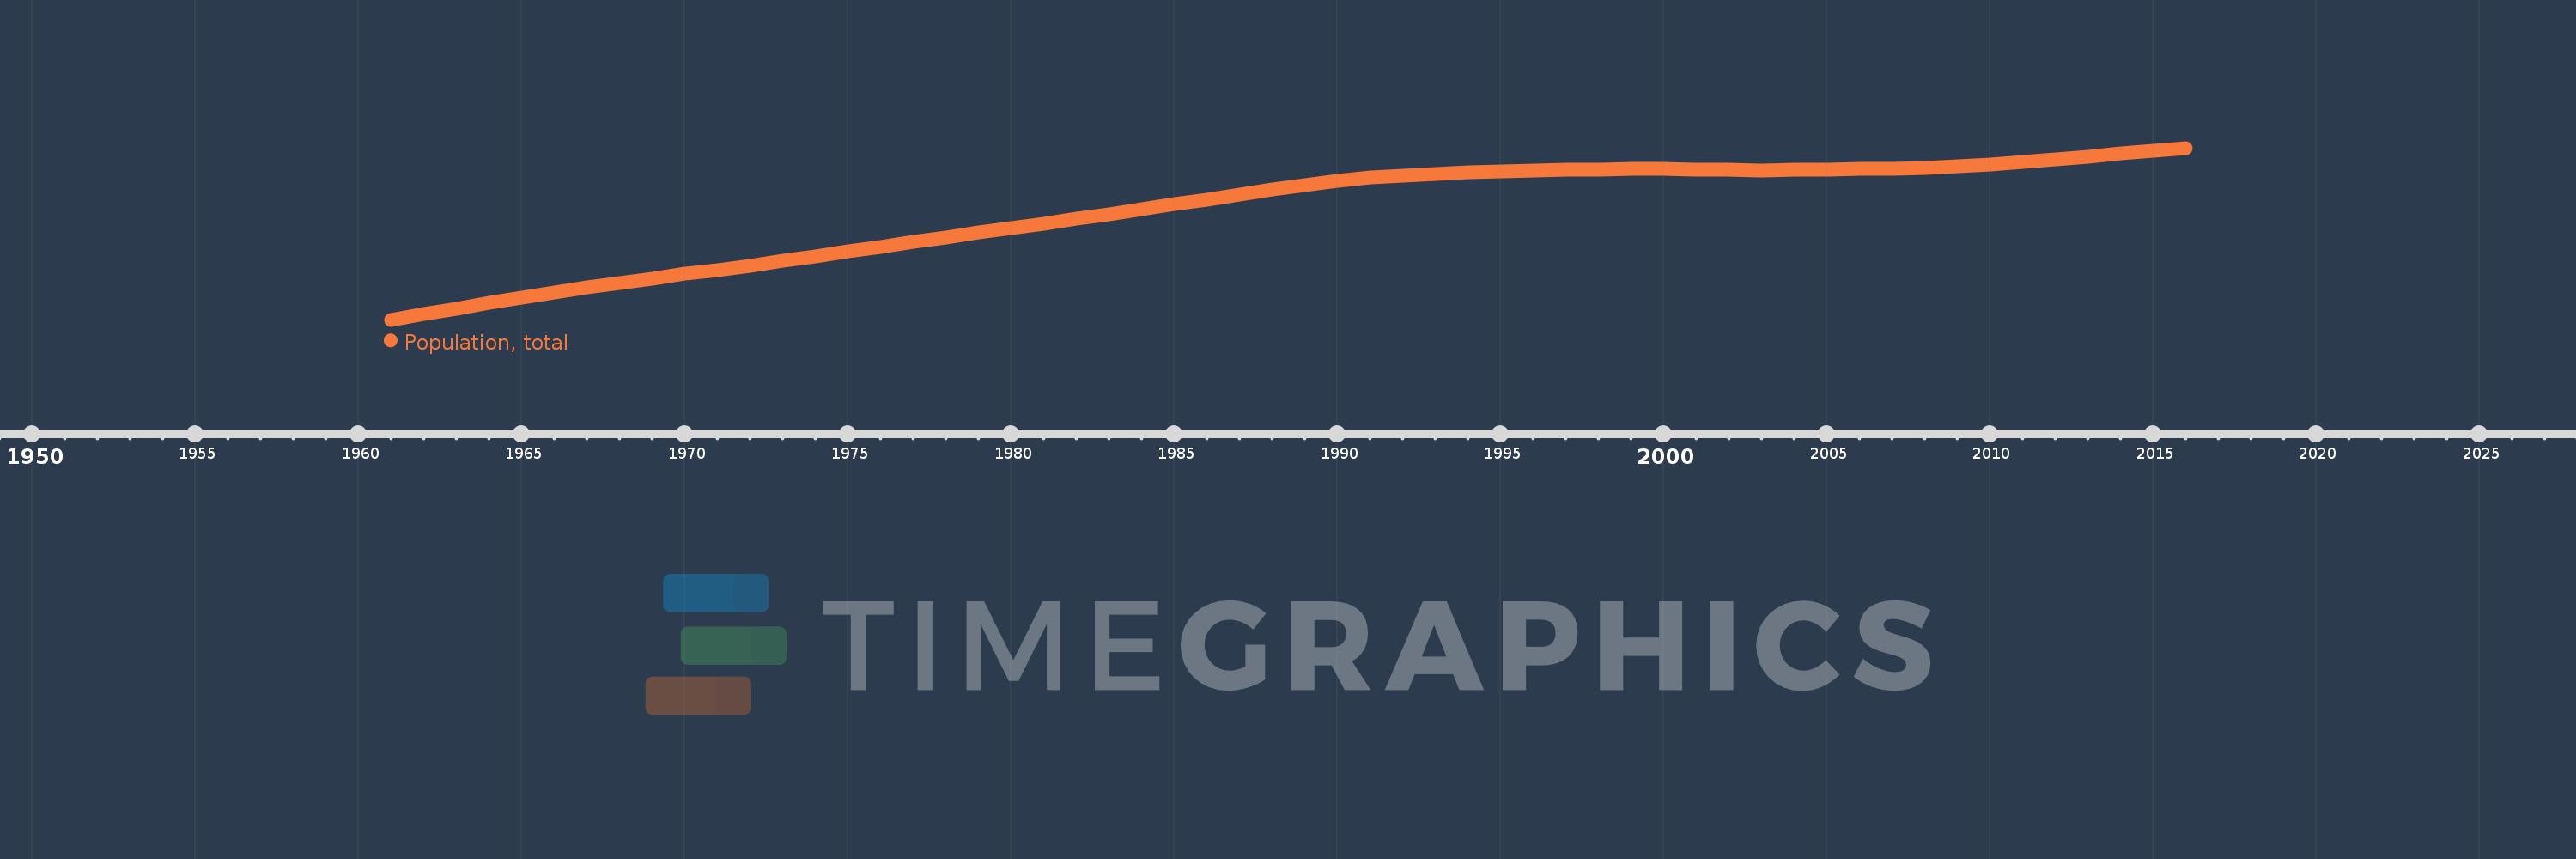
Population, total
2016,2015,2014,2013,2012,2011,2010,2009,2008,2007,2006,2005,2004,2003,2002,2001,2000,1999,1998,1997,1996,1995,1994,1993,1992,1991,1990,1989,1988,1987,1986,1985,1984,1983,1982,1981,1980,1979,1978,1977,1976,1975,1974,1973,1972,1971,1970,1969,1968,1967,1966,1965,1964,1963,1962,1961
This statistics in other country:
AfghanistanAlbaniaAlgeriaAmerican SamoaAndorraAngolaAntigua and BarbudaArab WorldArgentinaArmeniaArubaAustraliaAustriaAzerbaijanBahamas, TheBahrainBangladeshBarbadosBelarusBelgiumBelizeBeninBermudaBhutanBoliviaBosnia and HerzegovinaBotswanaBrazilBritish Virgin IslandsBrunei DarussalamBulgariaBurkina FasoBurundiCabo VerdeCambodiaCameroonCanadaCaribbean small statesCayman IslandsCentral African RepublicCentral Europe and the BalticsChadChannel IslandsChileChinaColombiaComorosCongo, Dem. Rep.Congo, Rep.Costa RicaCote d'IvoireCroatiaCubaCuracaoCyprusCzech RepublicDenmarkDjiboutiDominicaDominican RepublicEarly-demographic dividendEast Asia & PacificEast Asia & Pacific (excluding high income)East Asia & Pacific (IDA & IBRD countries)EcuadorEgypt, Arab Rep.El SalvadorEquatorial GuineaEritreaEstoniaEthiopiaEuro areaEurope & Central AsiaEurope & Central Asia (excluding high income)Europe & Central Asia (IDA & IBRD countries)European UnionFaroe IslandsFijiFinlandFragile and conflict affected situationsFranceFrench PolynesiaGabonGambia, TheGeorgiaGermanyGhanaGibraltarGreeceGreenlandGrenadaGuamGuatemalaGuineaGuinea-BissauGuyanaHaitiHeavily indebted poor countries (HIPC)High incomeHondurasHong Kong SAR, ChinaHungaryIBRD onlyIcelandIDA & IBRD totalIDA blendIDA onlyIDA totalIndiaIndonesiaIran, Islamic Rep.IraqIrelandIsle of ManIsraelItalyJamaicaJapanJordanKazakhstanKenyaKiribatiKorea, Dem. People’s Rep.Korea, Rep.KosovoKuwaitKyrgyz RepublicLao PDRLate-demographic dividendLatin America & Caribbean Latin America & Caribbean (excluding high income)Latin America & the Caribbean (IDA & IBRD countries)LatviaLeast developed countries: UN classificationLebanonLesothoLiberiaLibyaLiechtensteinLithuaniaLow & middle incomeLow incomeLower middle incomeLuxembourgMacao SAR, ChinaMacedonia, FYRMadagascarMalawiMalaysiaMaldivesMaliMaltaMarshall IslandsMauritaniaMauritiusMexicoMicronesia, Fed. Sts.Middle East & North AfricaMiddle East & North Africa (excluding high income)Middle East & North Africa (IDA & IBRD countries)Middle incomeMoldovaMonacoMongoliaMontenegroMoroccoMozambiqueMyanmarNamibiaNauruNepalNetherlandsNew CaledoniaNew ZealandNicaraguaNigerNigeriaNorth AmericaNorthern Mariana IslandsNorwayOECD membersOmanOther small statesPacific island small statesPakistanPalauPanamaPapua New GuineaParaguayPeruPhilippinesPolandPortugalPost-demographic dividendPre-demographic dividendPuerto RicoQatarRomaniaRussian FederationRwandaSamoaSan MarinoSao Tome and PrincipeSaudi ArabiaSenegalSerbiaSeychellesSierra LeoneSingaporeSint Maarten (Dutch part)Slovak RepublicSloveniaSmall statesSolomon IslandsSomaliaSouth AfricaSouth AsiaSouth Asia (IDA & IBRD)South SudanSpainSri LankaSt. Kitts and NevisSt. LuciaSt. Martin (French part)St. Vincent and the GrenadinesSub-Saharan Africa Sub-Saharan Africa (excluding high income)Sub-Saharan Africa (IDA & IBRD countries)SudanSurinameSwazilandSwedenSwitzerlandSyrian Arab RepublicTajikistanTanzaniaThailandTimor-LesteTogoTongaTrinidad and TobagoTunisiaTurkeyTurkmenistanTurks and Caicos IslandsTuvaluUgandaUkraineUnited Arab EmiratesUnited KingdomUnited StatesUpper middle incomeUruguayUzbekistanVanuatuVenezuela, RBVietnamVirgin Islands (U.S.)West Bank and GazaWorldYemen, Rep.ZambiaZimbabwe Timeline:
This timeline shows a graph from 1961 to 2016 of Europe & Central Asia (IDA & IBRD countries). No data until 1960. Number of actual observations by date: 56.
Source name:
World Development Indicators
Source organization:
(1) United Nations Population Division. World Population Prospects, (2) Census reports and other statistical publications from national statistical offices, (3) Eurostat: Demographic Statistics, (4) United Nations Statistical Division. Population and Vital Statistics Report (various years), (5) U.S. Census Bureau: International Database, and (6) Secretariat of the Pacific Community: Statistics and Demography Programme.
Categories, topics:
Climate Change, Health
Last updated:
apr 23, 2017
Indicators value changes by year
Minimum:
308.998 mln
jan 1, 1961
Maximum:
453.562 mln
jan 1, 2016
At the date of observation
Value
Absolute change
Change from previous value
jan 1, 1961
308.998 mln
+308.998 mln
0.0%
jan 1, 1962
313.625 mln
+4.626 mln
1.5%
jan 1, 1963
318.287 mln
+4.662 mln
1.49%
jan 1, 1964
323.018 mln
+4.731 mln
1.49%
jan 1, 1965
327.746 mln
+4.728 mln
1.46%
jan 1, 1966
332.271 mln
+4.525 mln
1.38%
jan 1, 1967
336.043 mln
+3.772 mln
1.14%
jan 1, 1968
339.937 mln
+3.894 mln
1.16%
jan 1, 1969
343.746 mln
+3.809 mln
1.12%
jan 1, 1970
347.457 mln
+3.71 mln
1.08%
jan 1, 1971
350.93 mln
+3.473 mln
1.0%
jan 1, 1972
354.605 mln
+3.675 mln
1.05%
jan 1, 1973
358.622 mln
+4.017 mln
1.13%
jan 1, 1974
362.515 mln
+3.893 mln
1.09%
jan 1, 1975
366.435 mln
+3.92 mln
1.08%
jan 1, 1976
370.358 mln
+3.923 mln
1.07%
jan 1, 1977
374.401 mln
+4.043 mln
1.09%
jan 1, 1978
378.332 mln
+3.931 mln
1.05%
jan 1, 1979
382.173 mln
+3.841 mln
1.02%
jan 1, 1980
385.995 mln
+3.822 mln
1.0%
jan 1, 1981
389.981 mln
+3.987 mln
1.03%
jan 1, 1982
394.058 mln
+4.077 mln
1.05%
jan 1, 1983
397.99 mln
+3.932 mln
1.0%
jan 1, 1984
401.923 mln
+3.932 mln
0.99%
jan 1, 1985
406.092 mln
+4.169 mln
1.04%
jan 1, 1986
410.238 mln
+4.146 mln
1.02%
jan 1, 1987
414.309 mln
+4.071 mln
0.99%
jan 1, 1988
418.318 mln
+4.009 mln
0.97%
jan 1, 1989
422.146 mln
+3.828 mln
0.92%
jan 1, 1990
425.77 mln
+3.624 mln
0.86%
jan 1, 1991
428.459 mln
+2.689 mln
0.63%
jan 1, 1992
430.29 mln
+1.832 mln
0.43%
jan 1, 1993
431.966 mln
+1.676 mln
0.39%
jan 1, 1994
433.465 mln
+1.499 mln
0.35%
jan 1, 1995
434.183 mln
+718.088K
0.17%
jan 1, 1996
434.696 mln
+512.779K
0.12%
jan 1, 1997
434.935 mln
+239.189K
0.06%
jan 1, 1998
435.429 mln
+493.625K
0.11%
jan 1, 1999
435.652 mln
+223.277K
0.05%
jan 1, 2000
435.716 mln
+64.241K
0.01%
jan 1, 2001
435.333 mln
-383.152K
-0.09%
jan 1, 2002
435.104 mln
-229.564K
-0.05%
jan 1, 2003
434.793 mln
-310.797K
-0.07%
jan 1, 2004
434.933 mln
+140.465K
0.03%
jan 1, 2005
435.276 mln
+342.422K
0.08%
jan 1, 2006
435.685 mln
+409.266K
0.09%
jan 1, 2007
436.218 mln
+533.406K
0.12%
jan 1, 2008
436.774 mln
+555.334K
0.13%
jan 1, 2009
437.826 mln
+1.052 mln
0.24%
jan 1, 2010
439.619 mln
+1.792 mln
0.41%
jan 1, 2011
441.582 mln
+1.964 mln
0.45%
jan 1, 2012
443.792 mln
+2.21 mln
0.5%
jan 1, 2013
446.161 mln
+2.369 mln
0.53%
jan 1, 2014
448.721 mln
+2.559 mln
0.57%
jan 1, 2015
451.234 mln
+2.514 mln
0.56%
jan 1, 2016
453.562 mln
+2.328 mln
0.52%
Ranking of countries by current statistics by years


Comments: