29
/
en
AIzaSyAYiBZKx7MnpbEhh9jyipgxe19OcubqV5w
April 1, 2024
157779
Iran, Islamic Rep.
IRN
true
2
1
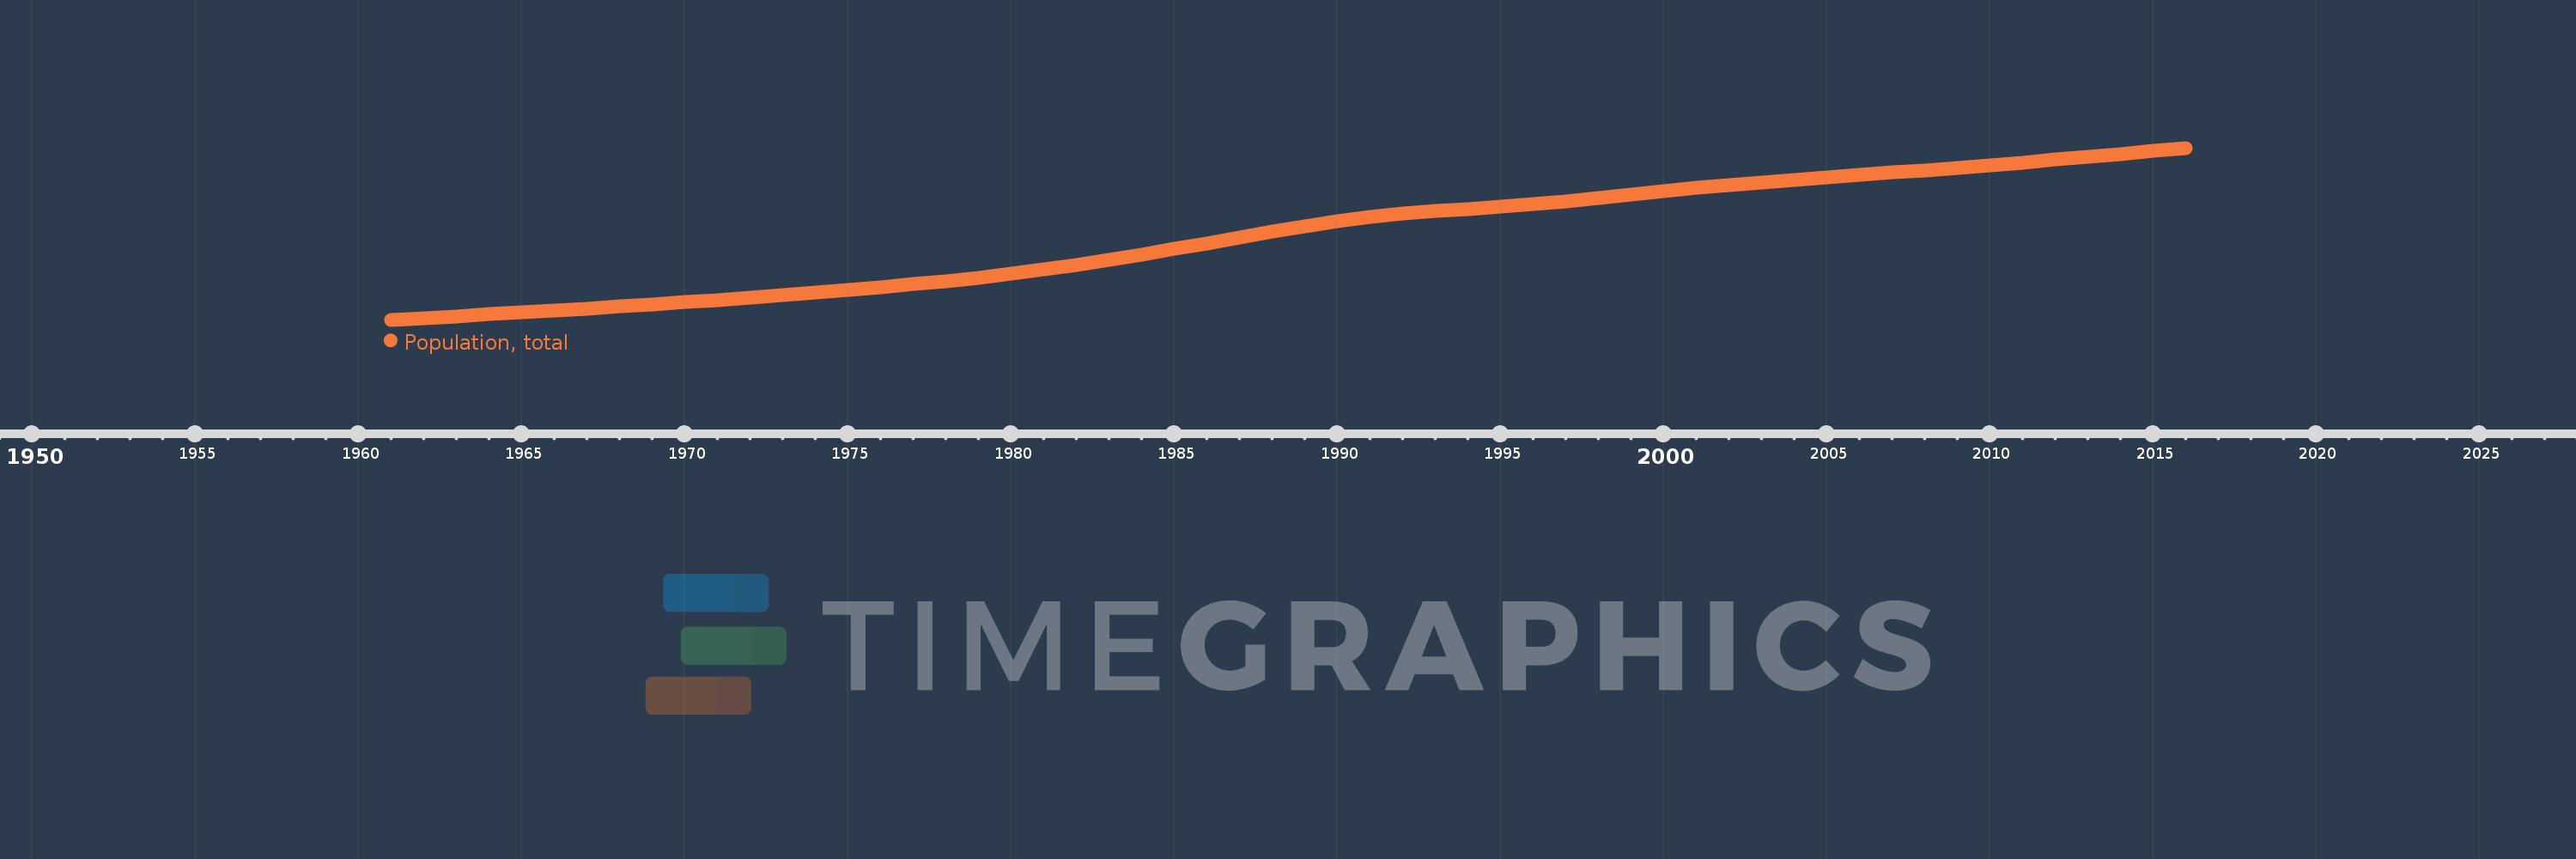
Population, total
2016,2015,2014,2013,2012,2011,2010,2009,2008,2007,2006,2005,2004,2003,2002,2001,2000,1999,1998,1997,1996,1995,1994,1993,1992,1991,1990,1989,1988,1987,1986,1985,1984,1983,1982,1981,1980,1979,1978,1977,1976,1975,1974,1973,1972,1971,1970,1969,1968,1967,1966,1965,1964,1963,1962,1961
This statistics in other country:
AfghanistanAlbaniaAlgeriaAmerican SamoaAndorraAngolaAntigua and BarbudaArab WorldArgentinaArmeniaArubaAustraliaAustriaAzerbaijanBahamas, TheBahrainBangladeshBarbadosBelarusBelgiumBelizeBeninBermudaBhutanBoliviaBosnia and HerzegovinaBotswanaBrazilBritish Virgin IslandsBrunei DarussalamBulgariaBurkina FasoBurundiCabo VerdeCambodiaCameroonCanadaCaribbean small statesCayman IslandsCentral African RepublicCentral Europe and the BalticsChadChannel IslandsChileChinaColombiaComorosCongo, Dem. Rep.Congo, Rep.Costa RicaCote d'IvoireCroatiaCubaCuracaoCyprusCzech RepublicDenmarkDjiboutiDominicaDominican RepublicEarly-demographic dividendEast Asia & PacificEast Asia & Pacific (excluding high income)East Asia & Pacific (IDA & IBRD countries)EcuadorEgypt, Arab Rep.El SalvadorEquatorial GuineaEritreaEstoniaEthiopiaEuro areaEurope & Central AsiaEurope & Central Asia (excluding high income)Europe & Central Asia (IDA & IBRD countries)European UnionFaroe IslandsFijiFinlandFragile and conflict affected situationsFranceFrench PolynesiaGabonGambia, TheGeorgiaGermanyGhanaGibraltarGreeceGreenlandGrenadaGuamGuatemalaGuineaGuinea-BissauGuyanaHaitiHeavily indebted poor countries (HIPC)High incomeHondurasHong Kong SAR, ChinaHungaryIBRD onlyIcelandIDA & IBRD totalIDA blendIDA onlyIDA totalIndiaIndonesiaIran, Islamic Rep.IraqIrelandIsle of ManIsraelItalyJamaicaJapanJordanKazakhstanKenyaKiribatiKorea, Dem. People’s Rep.Korea, Rep.KosovoKuwaitKyrgyz RepublicLao PDRLate-demographic dividendLatin America & Caribbean Latin America & Caribbean (excluding high income)Latin America & the Caribbean (IDA & IBRD countries)LatviaLeast developed countries: UN classificationLebanonLesothoLiberiaLibyaLiechtensteinLithuaniaLow & middle incomeLow incomeLower middle incomeLuxembourgMacao SAR, ChinaMacedonia, FYRMadagascarMalawiMalaysiaMaldivesMaliMaltaMarshall IslandsMauritaniaMauritiusMexicoMicronesia, Fed. Sts.Middle East & North AfricaMiddle East & North Africa (excluding high income)Middle East & North Africa (IDA & IBRD countries)Middle incomeMoldovaMonacoMongoliaMontenegroMoroccoMozambiqueMyanmarNamibiaNauruNepalNetherlandsNew CaledoniaNew ZealandNicaraguaNigerNigeriaNorth AmericaNorthern Mariana IslandsNorwayOECD membersOmanOther small statesPacific island small statesPakistanPalauPanamaPapua New GuineaParaguayPeruPhilippinesPolandPortugalPost-demographic dividendPre-demographic dividendPuerto RicoQatarRomaniaRussian FederationRwandaSamoaSan MarinoSao Tome and PrincipeSaudi ArabiaSenegalSerbiaSeychellesSierra LeoneSingaporeSint Maarten (Dutch part)Slovak RepublicSloveniaSmall statesSolomon IslandsSomaliaSouth AfricaSouth AsiaSouth Asia (IDA & IBRD)South SudanSpainSri LankaSt. Kitts and NevisSt. LuciaSt. Martin (French part)St. Vincent and the GrenadinesSub-Saharan Africa Sub-Saharan Africa (excluding high income)Sub-Saharan Africa (IDA & IBRD countries)SudanSurinameSwazilandSwedenSwitzerlandSyrian Arab RepublicTajikistanTanzaniaThailandTimor-LesteTogoTongaTrinidad and TobagoTunisiaTurkeyTurkmenistanTurks and Caicos IslandsTuvaluUgandaUkraineUnited Arab EmiratesUnited KingdomUnited StatesUpper middle incomeUruguayUzbekistanVanuatuVenezuela, RBVietnamVirgin Islands (U.S.)West Bank and GazaWorldYemen, Rep.ZambiaZimbabwe Timeline:
This timeline shows a graph from 1961 to 2016 of Iran, Islamic Rep.. No data until 1960. Number of actual observations by date: 56.
Source name:
World Development Indicators
Source organization:
(1) United Nations Population Division. World Population Prospects, (2) Census reports and other statistical publications from national statistical offices, (3) Eurostat: Demographic Statistics, (4) United Nations Statistical Division. Population and Vital Statistics Report (various years), (5) U.S. Census Bureau: International Database, and (6) Secretariat of the Pacific Community: Statistics and Demography Programme.
Categories, topics:
Climate Change, Health
Last updated:
apr 23, 2017
Indicators value changes by year
Minimum:
21.907 mln
jan 1, 1961
Maximum:
79.109 mln
jan 1, 2016
At the date of observation
Value
Absolute change
Change from previous value
jan 1, 1961
21.907 mln
+21.907 mln
0.0%
jan 1, 1962
22.48 mln
+573.515K
2.62%
jan 1, 1963
23.071 mln
+591.006K
2.63%
jan 1, 1964
23.68 mln
+609.007K
2.64%
jan 1, 1965
24.308 mln
+627.647K
2.65%
jan 1, 1966
24.955 mln
+647.036K
2.66%
jan 1, 1967
25.625 mln
+669.534K
2.68%
jan 1, 1968
26.318 mln
+693.466K
2.71%
jan 1, 1969
27.033 mln
+714.828K
2.72%
jan 1, 1970
27.765 mln
+732.295K
2.71%
jan 1, 1971
28.514 mln
+748.772K
2.7%
jan 1, 1972
29.281 mln
+767.119K
2.69%
jan 1, 1973
30.074 mln
+792.715K
2.71%
jan 1, 1974
30.904 mln
+829.72K
2.76%
jan 1, 1975
31.785 mln
+881.331K
2.85%
jan 1, 1976
32.731 mln
+945.659K
2.98%
jan 1, 1977
33.739 mln
+1.009 mln
3.08%
jan 1, 1978
34.814 mln
+1.075 mln
3.19%
jan 1, 1979
35.978 mln
+1.163 mln
3.34%
jan 1, 1980
37.257 mln
+1.279 mln
3.56%
jan 1, 1981
38.668 mln
+1.411 mln
3.79%
jan 1, 1982
40.209 mln
+1.541 mln
3.98%
jan 1, 1983
41.862 mln
+1.653 mln
4.11%
jan 1, 1984
43.611 mln
+1.748 mln
4.18%
jan 1, 1985
45.429 mln
+1.819 mln
4.17%
jan 1, 1986
47.291 mln
+1.862 mln
4.1%
jan 1, 1987
49.206 mln
+1.915 mln
4.05%
jan 1, 1988
51.152 mln
+1.947 mln
3.96%
jan 1, 1989
53.036 mln
+1.884 mln
3.68%
jan 1, 1990
54.735 mln
+1.699 mln
3.2%
jan 1, 1991
56.169 mln
+1.434 mln
2.62%
jan 1, 1992
57.288 mln
+1.119 mln
1.99%
jan 1, 1993
58.13 mln
+842.06K
1.47%
jan 1, 1994
58.812 mln
+681.759K
1.17%
jan 1, 1995
59.501 mln
+689.434K
1.17%
jan 1, 1996
60.319 mln
+817.34K
1.37%
jan 1, 1997
61.307 mln
+988.0K
1.64%
jan 1, 1998
62.426 mln
+1.119 mln
1.83%
jan 1, 1999
63.616 mln
+1.19 mln
1.91%
jan 1, 2000
64.78 mln
+1.164 mln
1.83%
jan 1, 2001
65.85 mln
+1.07 mln
1.65%
jan 1, 2002
66.813 mln
+962.674K
1.46%
jan 1, 2003
67.697 mln
+883.941K
1.32%
jan 1, 2004
68.522 mln
+825.397K
1.22%
jan 1, 2005
69.322 mln
+799.879K
1.17%
jan 1, 2006
70.122 mln
+800.162K
1.15%
jan 1, 2007
70.923 mln
+801.049K
1.14%
jan 1, 2008
71.721 mln
+797.695K
1.12%
jan 1, 2009
72.531 mln
+809.834K
1.13%
jan 1, 2010
73.371 mln
+840.289K
1.16%
jan 1, 2011
74.253 mln
+882.391K
1.2%
jan 1, 2012
75.184 mln
+930.949K
1.25%
jan 1, 2013
76.157 mln
+972.653K
1.29%
jan 1, 2014
77.152 mln
+995.47K
1.31%
jan 1, 2015
78.144 mln
+991.199K
1.28%
jan 1, 2016
79.109 mln
+965.628K
1.24%
Ranking of countries by current statistics by years


Comments: