29
/
en
AIzaSyAYiBZKx7MnpbEhh9jyipgxe19OcubqV5w
April 1, 2024
106450
China
CHN
true
2
1
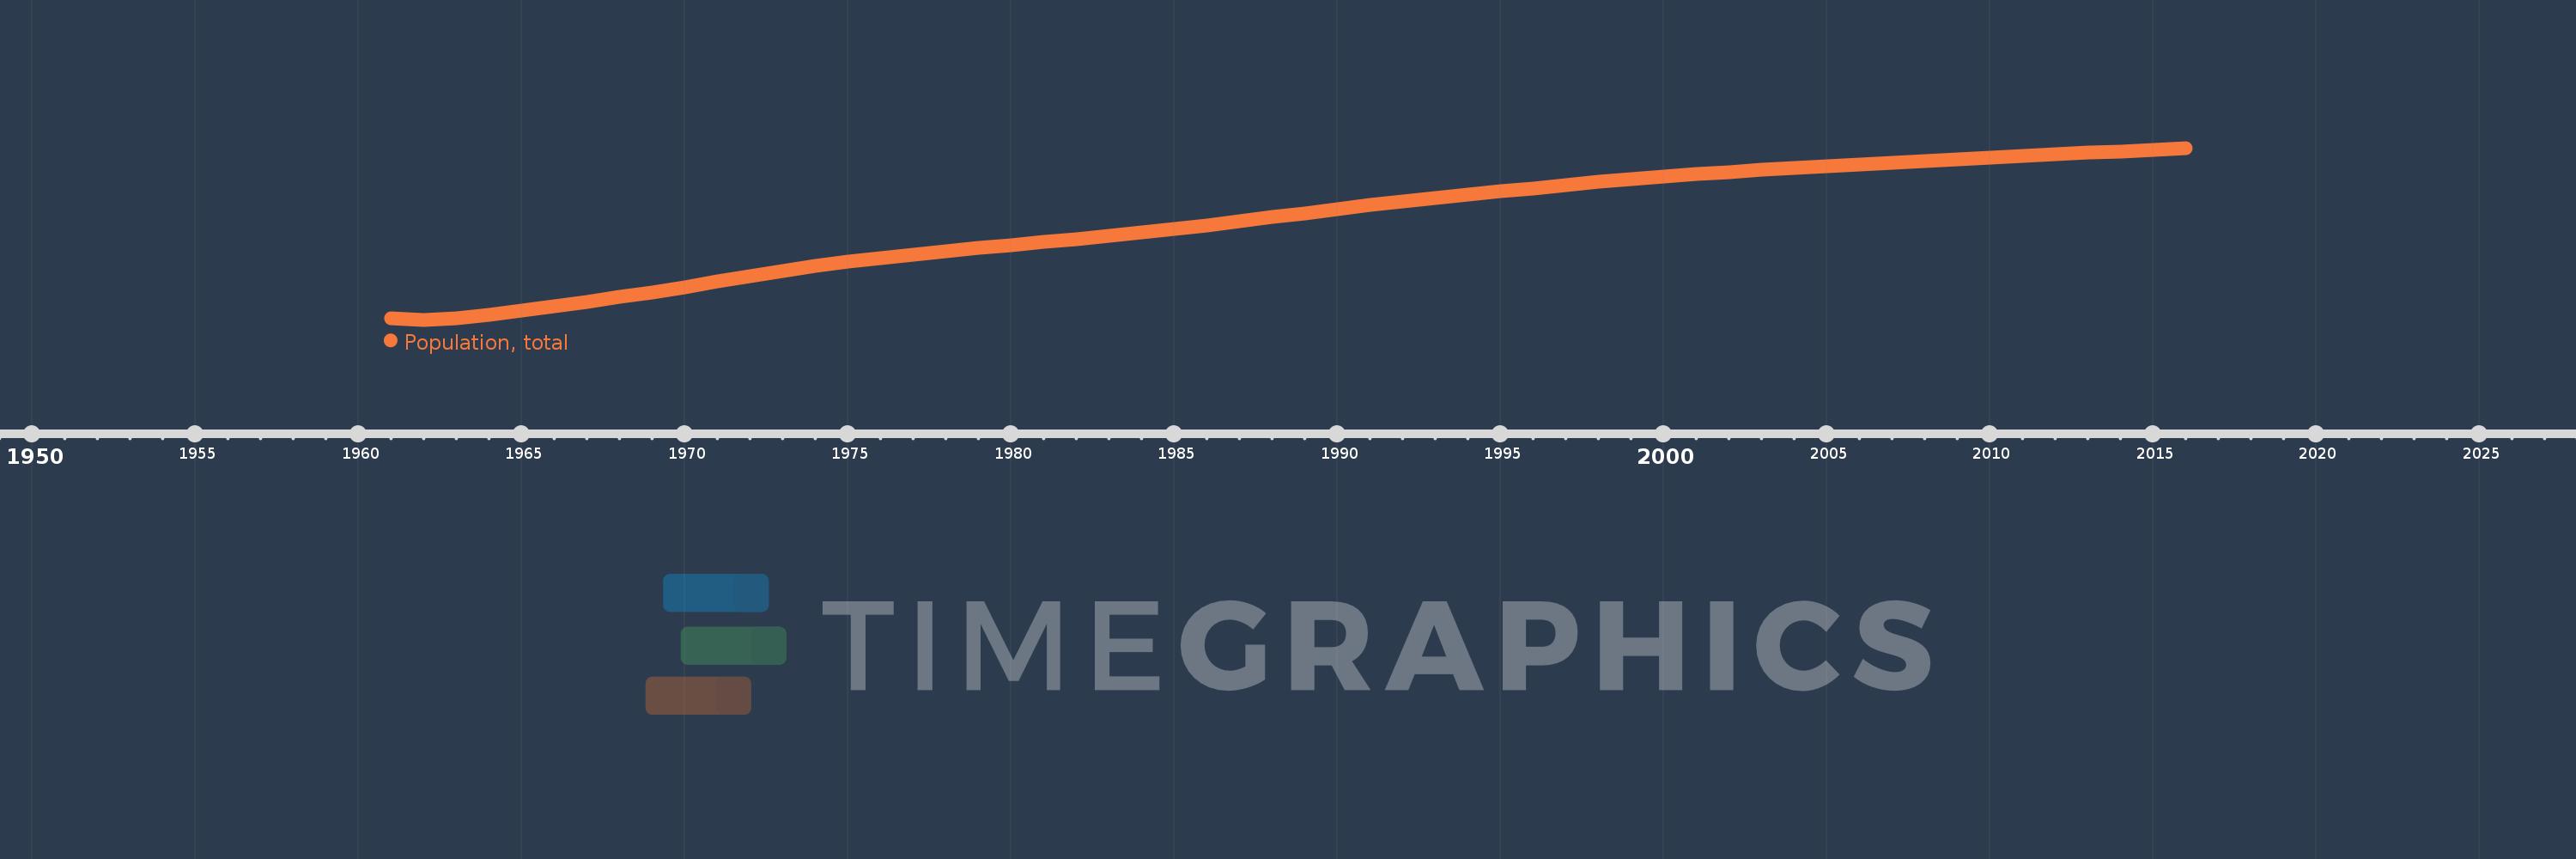
Population, total
2016,2015,2014,2013,2012,2011,2010,2009,2008,2007,2006,2005,2004,2003,2002,2001,2000,1999,1998,1997,1996,1995,1994,1993,1992,1991,1990,1989,1988,1987,1986,1985,1984,1983,1982,1981,1980,1979,1978,1977,1976,1975,1974,1973,1972,1971,1970,1969,1968,1967,1966,1965,1964,1963,1962,1961
This statistics in other country:
AfghanistanAlbaniaAlgeriaAmerican SamoaAndorraAngolaAntigua and BarbudaArab WorldArgentinaArmeniaArubaAustraliaAustriaAzerbaijanBahamas, TheBahrainBangladeshBarbadosBelarusBelgiumBelizeBeninBermudaBhutanBoliviaBosnia and HerzegovinaBotswanaBrazilBritish Virgin IslandsBrunei DarussalamBulgariaBurkina FasoBurundiCabo VerdeCambodiaCameroonCanadaCaribbean small statesCayman IslandsCentral African RepublicCentral Europe and the BalticsChadChannel IslandsChileChinaColombiaComorosCongo, Dem. Rep.Congo, Rep.Costa RicaCote d'IvoireCroatiaCubaCuracaoCyprusCzech RepublicDenmarkDjiboutiDominicaDominican RepublicEarly-demographic dividendEast Asia & PacificEast Asia & Pacific (excluding high income)East Asia & Pacific (IDA & IBRD countries)EcuadorEgypt, Arab Rep.El SalvadorEquatorial GuineaEritreaEstoniaEthiopiaEuro areaEurope & Central AsiaEurope & Central Asia (excluding high income)Europe & Central Asia (IDA & IBRD countries)European UnionFaroe IslandsFijiFinlandFragile and conflict affected situationsFranceFrench PolynesiaGabonGambia, TheGeorgiaGermanyGhanaGibraltarGreeceGreenlandGrenadaGuamGuatemalaGuineaGuinea-BissauGuyanaHaitiHeavily indebted poor countries (HIPC)High incomeHondurasHong Kong SAR, ChinaHungaryIBRD onlyIcelandIDA & IBRD totalIDA blendIDA onlyIDA totalIndiaIndonesiaIran, Islamic Rep.IraqIrelandIsle of ManIsraelItalyJamaicaJapanJordanKazakhstanKenyaKiribatiKorea, Dem. People’s Rep.Korea, Rep.KosovoKuwaitKyrgyz RepublicLao PDRLate-demographic dividendLatin America & Caribbean Latin America & Caribbean (excluding high income)Latin America & the Caribbean (IDA & IBRD countries)LatviaLeast developed countries: UN classificationLebanonLesothoLiberiaLibyaLiechtensteinLithuaniaLow & middle incomeLow incomeLower middle incomeLuxembourgMacao SAR, ChinaMacedonia, FYRMadagascarMalawiMalaysiaMaldivesMaliMaltaMarshall IslandsMauritaniaMauritiusMexicoMicronesia, Fed. Sts.Middle East & North AfricaMiddle East & North Africa (excluding high income)Middle East & North Africa (IDA & IBRD countries)Middle incomeMoldovaMonacoMongoliaMontenegroMoroccoMozambiqueMyanmarNamibiaNauruNepalNetherlandsNew CaledoniaNew ZealandNicaraguaNigerNigeriaNorth AmericaNorthern Mariana IslandsNorwayOECD membersOmanOther small statesPacific island small statesPakistanPalauPanamaPapua New GuineaParaguayPeruPhilippinesPolandPortugalPost-demographic dividendPre-demographic dividendPuerto RicoQatarRomaniaRussian FederationRwandaSamoaSan MarinoSao Tome and PrincipeSaudi ArabiaSenegalSerbiaSeychellesSierra LeoneSingaporeSint Maarten (Dutch part)Slovak RepublicSloveniaSmall statesSolomon IslandsSomaliaSouth AfricaSouth AsiaSouth Asia (IDA & IBRD)South SudanSpainSri LankaSt. Kitts and NevisSt. LuciaSt. Martin (French part)St. Vincent and the GrenadinesSub-Saharan Africa Sub-Saharan Africa (excluding high income)Sub-Saharan Africa (IDA & IBRD countries)SudanSurinameSwazilandSwedenSwitzerlandSyrian Arab RepublicTajikistanTanzaniaThailandTimor-LesteTogoTongaTrinidad and TobagoTunisiaTurkeyTurkmenistanTurks and Caicos IslandsTuvaluUgandaUkraineUnited Arab EmiratesUnited KingdomUnited StatesUpper middle incomeUruguayUzbekistanVanuatuVenezuela, RBVietnamVirgin Islands (U.S.)West Bank and GazaWorldYemen, Rep.ZambiaZimbabwe Timeline:
This timeline shows a graph from 1961 to 2016 of China. No data until 1960. Number of actual observations by date: 56.
Source name:
World Development Indicators
Source organization:
(1) United Nations Population Division. World Population Prospects, (2) Census reports and other statistical publications from national statistical offices, (3) Eurostat: Demographic Statistics, (4) United Nations Statistical Division. Population and Vital Statistics Report (various years), (5) U.S. Census Bureau: International Database, and (6) Secretariat of the Pacific Community: Statistics and Demography Programme.
Categories, topics:
Climate Change, Health
Last updated:
apr 23, 2017
Indicators value changes by year
Minimum:
660.33 mln
jan 1, 1962
Maximum:
1.371 bln
jan 1, 2016
At the date of observation
Value
Absolute change
Change from previous value
jan 1, 1961
667.07 mln
+667.07 mln
0.0%
jan 1, 1962
660.33 mln
-6.74 mln
-1.01%
jan 1, 1963
665.77 mln
+5.44 mln
0.82%
jan 1, 1964
682.335 mln
+16.565 mln
2.49%
jan 1, 1965
698.355 mln
+16.02 mln
2.35%
jan 1, 1966
715.185 mln
+16.83 mln
2.41%
jan 1, 1967
735.4 mln
+20.215 mln
2.83%
jan 1, 1968
754.55 mln
+19.15 mln
2.6%
jan 1, 1969
774.51 mln
+19.96 mln
2.65%
jan 1, 1970
796.025 mln
+21.515 mln
2.78%
jan 1, 1971
818.315 mln
+22.29 mln
2.8%
jan 1, 1972
841.105 mln
+22.79 mln
2.78%
jan 1, 1973
862.03 mln
+20.925 mln
2.49%
jan 1, 1974
881.94 mln
+19.91 mln
2.31%
jan 1, 1975
900.35 mln
+18.41 mln
2.09%
jan 1, 1976
916.395 mln
+16.045 mln
1.78%
jan 1, 1977
930.685 mln
+14.29 mln
1.56%
jan 1, 1978
943.455 mln
+12.77 mln
1.37%
jan 1, 1979
956.165 mln
+12.71 mln
1.35%
jan 1, 1980
969.005 mln
+12.84 mln
1.34%
jan 1, 1981
981.235 mln
+12.23 mln
1.26%
jan 1, 1982
993.885 mln
+12.65 mln
1.29%
jan 1, 1983
1.009 bln
+14.745 mln
1.48%
jan 1, 1984
1.023 bln
+14.68 mln
1.46%
jan 1, 1985
1.037 bln
+13.515 mln
1.32%
jan 1, 1986
1.051 bln
+14.215 mln
1.37%
jan 1, 1987
1.067 bln
+15.75 mln
1.5%
jan 1, 1988
1.084 bln
+17.245 mln
1.62%
jan 1, 1989
1.102 bln
+17.595 mln
1.62%
jan 1, 1990
1.119 bln
+17.02 mln
1.54%
jan 1, 1991
1.135 bln
+16.535 mln
1.48%
jan 1, 1992
1.151 bln
+15.595 mln
1.37%
jan 1, 1993
1.165 bln
+14.19 mln
1.23%
jan 1, 1994
1.178 bln
+13.47 mln
1.16%
jan 1, 1995
1.192 bln
+13.395 mln
1.14%
jan 1, 1996
1.205 bln
+13.02 mln
1.09%
jan 1, 1997
1.218 bln
+12.695 mln
1.05%
jan 1, 1998
1.23 bln
+12.525 mln
1.03%
jan 1, 1999
1.242 bln
+11.86 mln
0.96%
jan 1, 2000
1.253 bln
+10.8 mln
0.87%
jan 1, 2001
1.263 bln
+9.91 mln
0.79%
jan 1, 2002
1.272 bln
+9.205 mln
0.73%
jan 1, 2003
1.28 bln
+8.55 mln
0.67%
jan 1, 2004
1.288 bln
+8.0 mln
0.62%
jan 1, 2005
1.296 bln
+7.675 mln
0.6%
jan 1, 2006
1.304 bln
+7.645 mln
0.59%
jan 1, 2007
1.311 bln
+7.3 mln
0.56%
jan 1, 2008
1.318 bln
+6.865 mln
0.52%
jan 1, 2009
1.325 bln
+6.77 mln
0.51%
jan 1, 2010
1.331 bln
+6.605 mln
0.5%
jan 1, 2011
1.338 bln
+6.445 mln
0.48%
jan 1, 2012
1.344 bln
+6.425 mln
0.48%
jan 1, 2013
1.351 bln
+6.565 mln
0.49%
jan 1, 2014
1.357 bln
+6.685 mln
0.49%
jan 1, 2015
1.364 bln
+6.89 mln
0.51%
jan 1, 2016
1.371 bln
+6.95 mln
0.51%
Ranking of countries by current statistics by years


Comments: