29
/
en
AIzaSyAYiBZKx7MnpbEhh9jyipgxe19OcubqV5w
April 1, 2024
127728
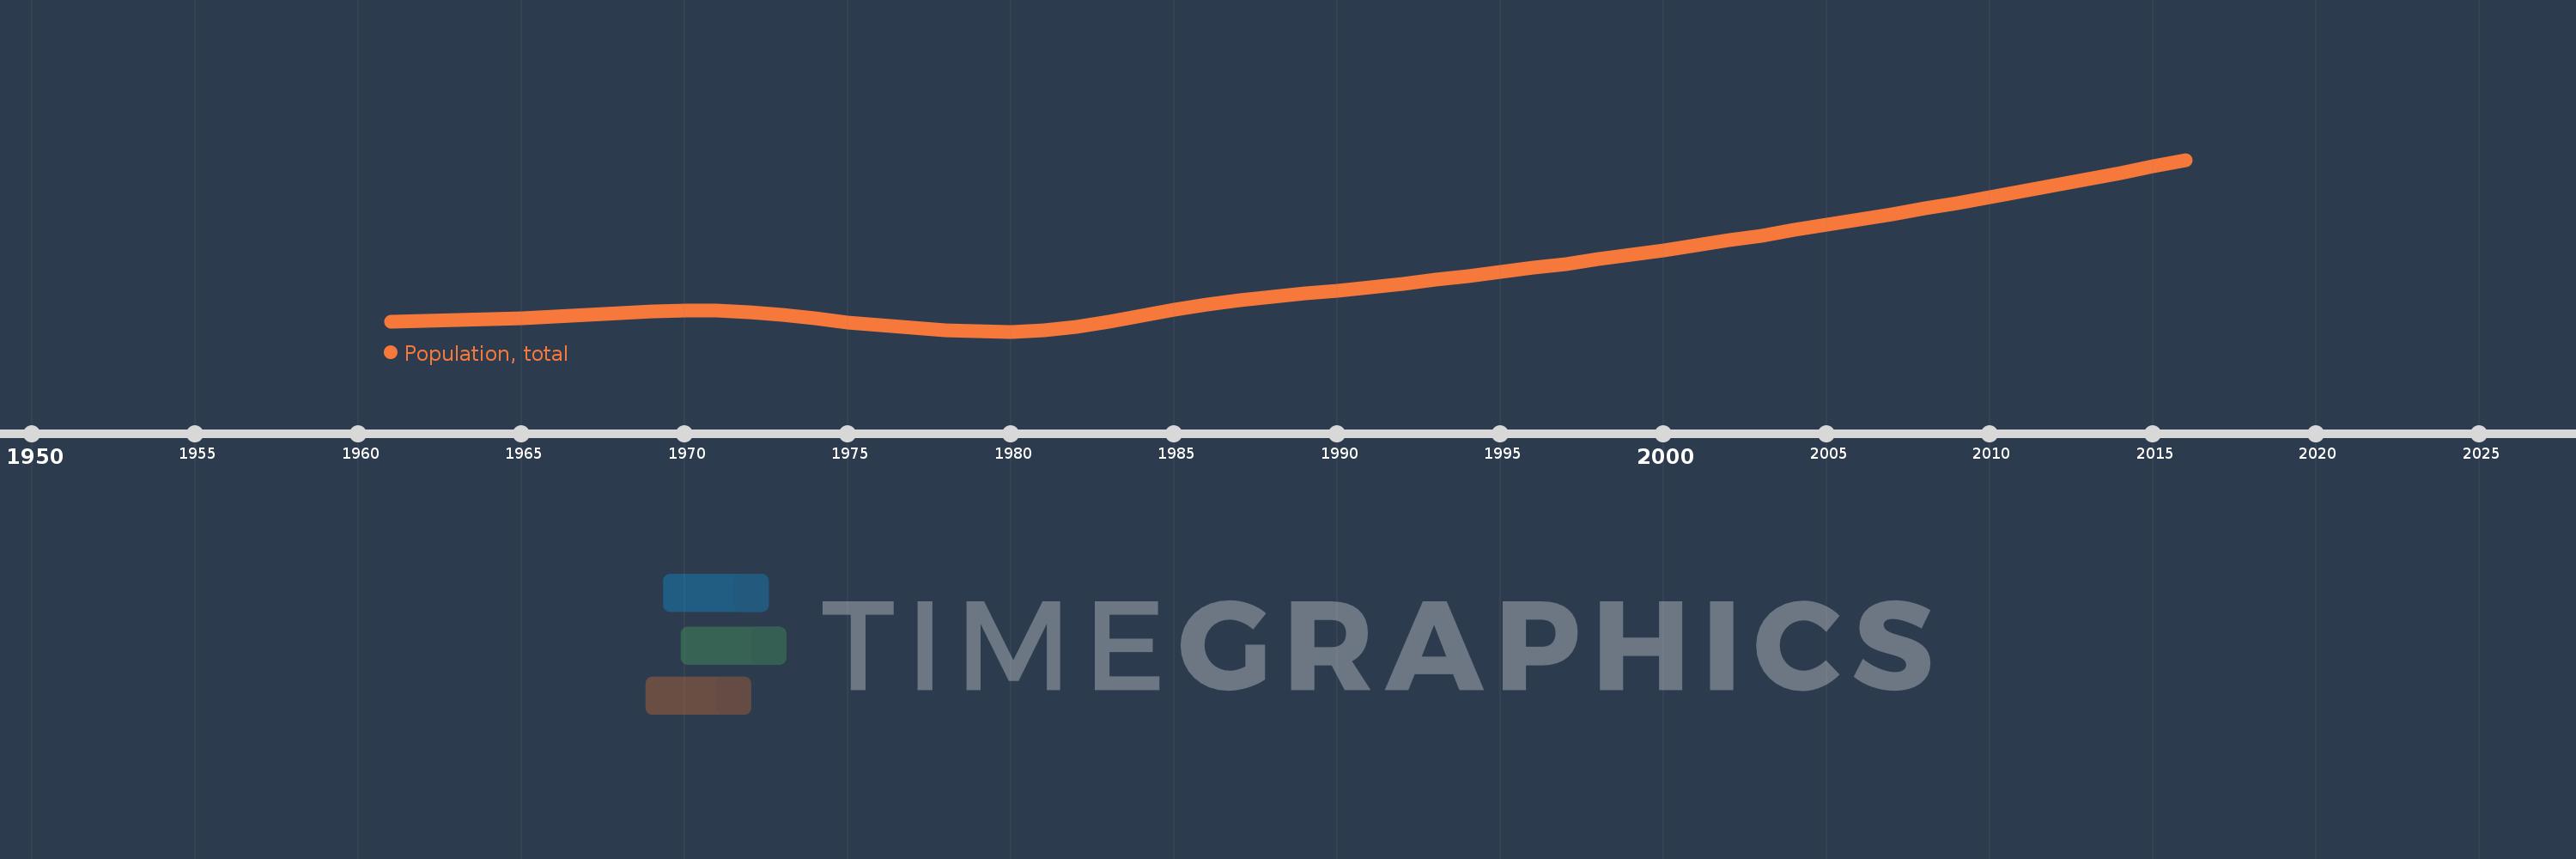
Equatorial Guinea
GNQ
true
2
1
Population, total
2016,2015,2014,2013,2012,2011,2010,2009,2008,2007,2006,2005,2004,2003,2002,2001,2000,1999,1998,1997,1996,1995,1994,1993,1992,1991,1990,1989,1988,1987,1986,1985,1984,1983,1982,1981,1980,1979,1978,1977,1976,1975,1974,1973,1972,1971,1970,1969,1968,1967,1966,1965,1964,1963,1962,1961
This statistics in other country:
AfghanistanAlbaniaAlgeriaAmerican SamoaAndorraAngolaAntigua and BarbudaArab WorldArgentinaArmeniaArubaAustraliaAustriaAzerbaijanBahamas, TheBahrainBangladeshBarbadosBelarusBelgiumBelizeBeninBermudaBhutanBoliviaBosnia and HerzegovinaBotswanaBrazilBritish Virgin IslandsBrunei DarussalamBulgariaBurkina FasoBurundiCabo VerdeCambodiaCameroonCanadaCaribbean small statesCayman IslandsCentral African RepublicCentral Europe and the BalticsChadChannel IslandsChileChinaColombiaComorosCongo, Dem. Rep.Congo, Rep.Costa RicaCote d'IvoireCroatiaCubaCuracaoCyprusCzech RepublicDenmarkDjiboutiDominicaDominican RepublicEarly-demographic dividendEast Asia & PacificEast Asia & Pacific (excluding high income)East Asia & Pacific (IDA & IBRD countries)EcuadorEgypt, Arab Rep.El SalvadorEquatorial GuineaEritreaEstoniaEthiopiaEuro areaEurope & Central AsiaEurope & Central Asia (excluding high income)Europe & Central Asia (IDA & IBRD countries)European UnionFaroe IslandsFijiFinlandFragile and conflict affected situationsFranceFrench PolynesiaGabonGambia, TheGeorgiaGermanyGhanaGibraltarGreeceGreenlandGrenadaGuamGuatemalaGuineaGuinea-BissauGuyanaHaitiHeavily indebted poor countries (HIPC)High incomeHondurasHong Kong SAR, ChinaHungaryIBRD onlyIcelandIDA & IBRD totalIDA blendIDA onlyIDA totalIndiaIndonesiaIran, Islamic Rep.IraqIrelandIsle of ManIsraelItalyJamaicaJapanJordanKazakhstanKenyaKiribatiKorea, Dem. People’s Rep.Korea, Rep.KosovoKuwaitKyrgyz RepublicLao PDRLate-demographic dividendLatin America & Caribbean Latin America & Caribbean (excluding high income)Latin America & the Caribbean (IDA & IBRD countries)LatviaLeast developed countries: UN classificationLebanonLesothoLiberiaLibyaLiechtensteinLithuaniaLow & middle incomeLow incomeLower middle incomeLuxembourgMacao SAR, ChinaMacedonia, FYRMadagascarMalawiMalaysiaMaldivesMaliMaltaMarshall IslandsMauritaniaMauritiusMexicoMicronesia, Fed. Sts.Middle East & North AfricaMiddle East & North Africa (excluding high income)Middle East & North Africa (IDA & IBRD countries)Middle incomeMoldovaMonacoMongoliaMontenegroMoroccoMozambiqueMyanmarNamibiaNauruNepalNetherlandsNew CaledoniaNew ZealandNicaraguaNigerNigeriaNorth AmericaNorthern Mariana IslandsNorwayOECD membersOmanOther small statesPacific island small statesPakistanPalauPanamaPapua New GuineaParaguayPeruPhilippinesPolandPortugalPost-demographic dividendPre-demographic dividendPuerto RicoQatarRomaniaRussian FederationRwandaSamoaSan MarinoSao Tome and PrincipeSaudi ArabiaSenegalSerbiaSeychellesSierra LeoneSingaporeSint Maarten (Dutch part)Slovak RepublicSloveniaSmall statesSolomon IslandsSomaliaSouth AfricaSouth AsiaSouth Asia (IDA & IBRD)South SudanSpainSri LankaSt. Kitts and NevisSt. LuciaSt. Martin (French part)St. Vincent and the GrenadinesSub-Saharan Africa Sub-Saharan Africa (excluding high income)Sub-Saharan Africa (IDA & IBRD countries)SudanSurinameSwazilandSwedenSwitzerlandSyrian Arab RepublicTajikistanTanzaniaThailandTimor-LesteTogoTongaTrinidad and TobagoTunisiaTurkeyTurkmenistanTurks and Caicos IslandsTuvaluUgandaUkraineUnited Arab EmiratesUnited KingdomUnited StatesUpper middle incomeUruguayUzbekistanVanuatuVenezuela, RBVietnamVirgin Islands (U.S.)West Bank and GazaWorldYemen, Rep.ZambiaZimbabwe Timeline:
This timeline shows a graph from 1961 to 2016 of Equatorial Guinea. No data until 1960. Number of actual observations by date: 56.
Source name:
World Development Indicators
Source organization:
(1) United Nations Population Division. World Population Prospects, (2) Census reports and other statistical publications from national statistical offices, (3) Eurostat: Demographic Statistics, (4) United Nations Statistical Division. Population and Vital Statistics Report (various years), (5) U.S. Census Bureau: International Database, and (6) Secretariat of the Pacific Community: Statistics and Demography Programme.
Categories, topics:
Climate Change, Health
Last updated:
apr 23, 2017
Indicators value changes by year
Minimum:
215.014K
jan 1, 1980
Maximum:
845.06K
jan 1, 2016
At the date of observation
Value
Absolute change
Change from previous value
jan 1, 1961
252.115K
+252.115K
0.0%
jan 1, 1962
255.1K
+2.985K
1.18%
jan 1, 1963
257.94K
+2.84K
1.11%
jan 1, 1964
260.99K
+3.05K
1.18%
jan 1, 1965
264.743K
+3.753K
1.44%
jan 1, 1966
269.427K
+4.684K
1.77%
jan 1, 1967
275.47K
+6.043K
2.24%
jan 1, 1968
282.445K
+6.975K
2.53%
jan 1, 1969
288.701K
+6.256K
2.21%
jan 1, 1970
292.014K
+3.313K
1.15%
jan 1, 1971
290.905K
-1.109K
-0.38%
jan 1, 1972
284.915K
-5.99K
-2.06%
jan 1, 1973
274.906K
-10.009K
-3.51%
jan 1, 1974
262.399K
-12.507K
-4.55%
jan 1, 1975
249.587K
-12.812K
-4.88%
jan 1, 1976
238.24K
-11.347K
-4.55%
jan 1, 1977
228.491K
-9.749K
-4.09%
jan 1, 1978
220.352K
-8.139K
-3.56%
jan 1, 1979
215.284K
-5.068K
-2.3%
jan 1, 1980
215.014K
-270.0
-0.13%
jan 1, 1981
220.605K
+5.591K
2.6%
jan 1, 1982
232.934K
+12.329K
5.59%
jan 1, 1983
251.301K
+18.367K
7.89%
jan 1, 1984
273.199K
+21.898K
8.71%
jan 1, 1985
295.09K
+21.891K
8.01%
jan 1, 1986
314.407K
+19.317K
6.55%
jan 1, 1987
330.247K
+15.84K
5.04%
jan 1, 1988
343.29K
+13.043K
3.95%
jan 1, 1989
354.488K
+11.198K
3.26%
jan 1, 1990
365.451K
+10.963K
3.09%
jan 1, 1991
377.363K
+11.912K
3.26%
jan 1, 1992
390.381K
+13.018K
3.45%
jan 1, 1993
404.081K
+13.7K
3.51%
jan 1, 1994
418.409K
+14.328K
3.55%
jan 1, 1995
433.197K
+14.788K
3.53%
jan 1, 1996
448.332K
+15.135K
3.49%
jan 1, 1997
463.844K
+15.512K
3.46%
jan 1, 1998
479.836K
+15.992K
3.45%
jan 1, 1999
496.33K
+16.494K
3.44%
jan 1, 2000
513.347K
+17.017K
3.43%
jan 1, 2001
530.896K
+17.549K
3.42%
jan 1, 2002
549.007K
+18.111K
3.41%
jan 1, 2003
567.664K
+18.657K
3.4%
jan 1, 2004
586.772K
+19.108K
3.37%
jan 1, 2005
606.201K
+19.429K
3.31%
jan 1, 2006
625.866K
+19.665K
3.24%
jan 1, 2007
645.718K
+19.852K
3.17%
jan 1, 2008
665.798K
+20.08K
3.11%
jan 1, 2009
686.223K
+20.425K
3.07%
jan 1, 2010
707.155K
+20.932K
3.05%
jan 1, 2011
728.71K
+21.555K
3.05%
jan 1, 2012
750.918K
+22.208K
3.05%
jan 1, 2013
773.729K
+22.811K
3.04%
jan 1, 2014
797.082K
+23.353K
3.02%
jan 1, 2015
820.885K
+23.803K
2.99%
jan 1, 2016
845.06K
+24.175K
2.94%
Ranking of countries by current statistics by years


Comments: