29
/
en
AIzaSyAYiBZKx7MnpbEhh9jyipgxe19OcubqV5w
April 1, 2024
63942
Afghanistan
AFG
true
2
1
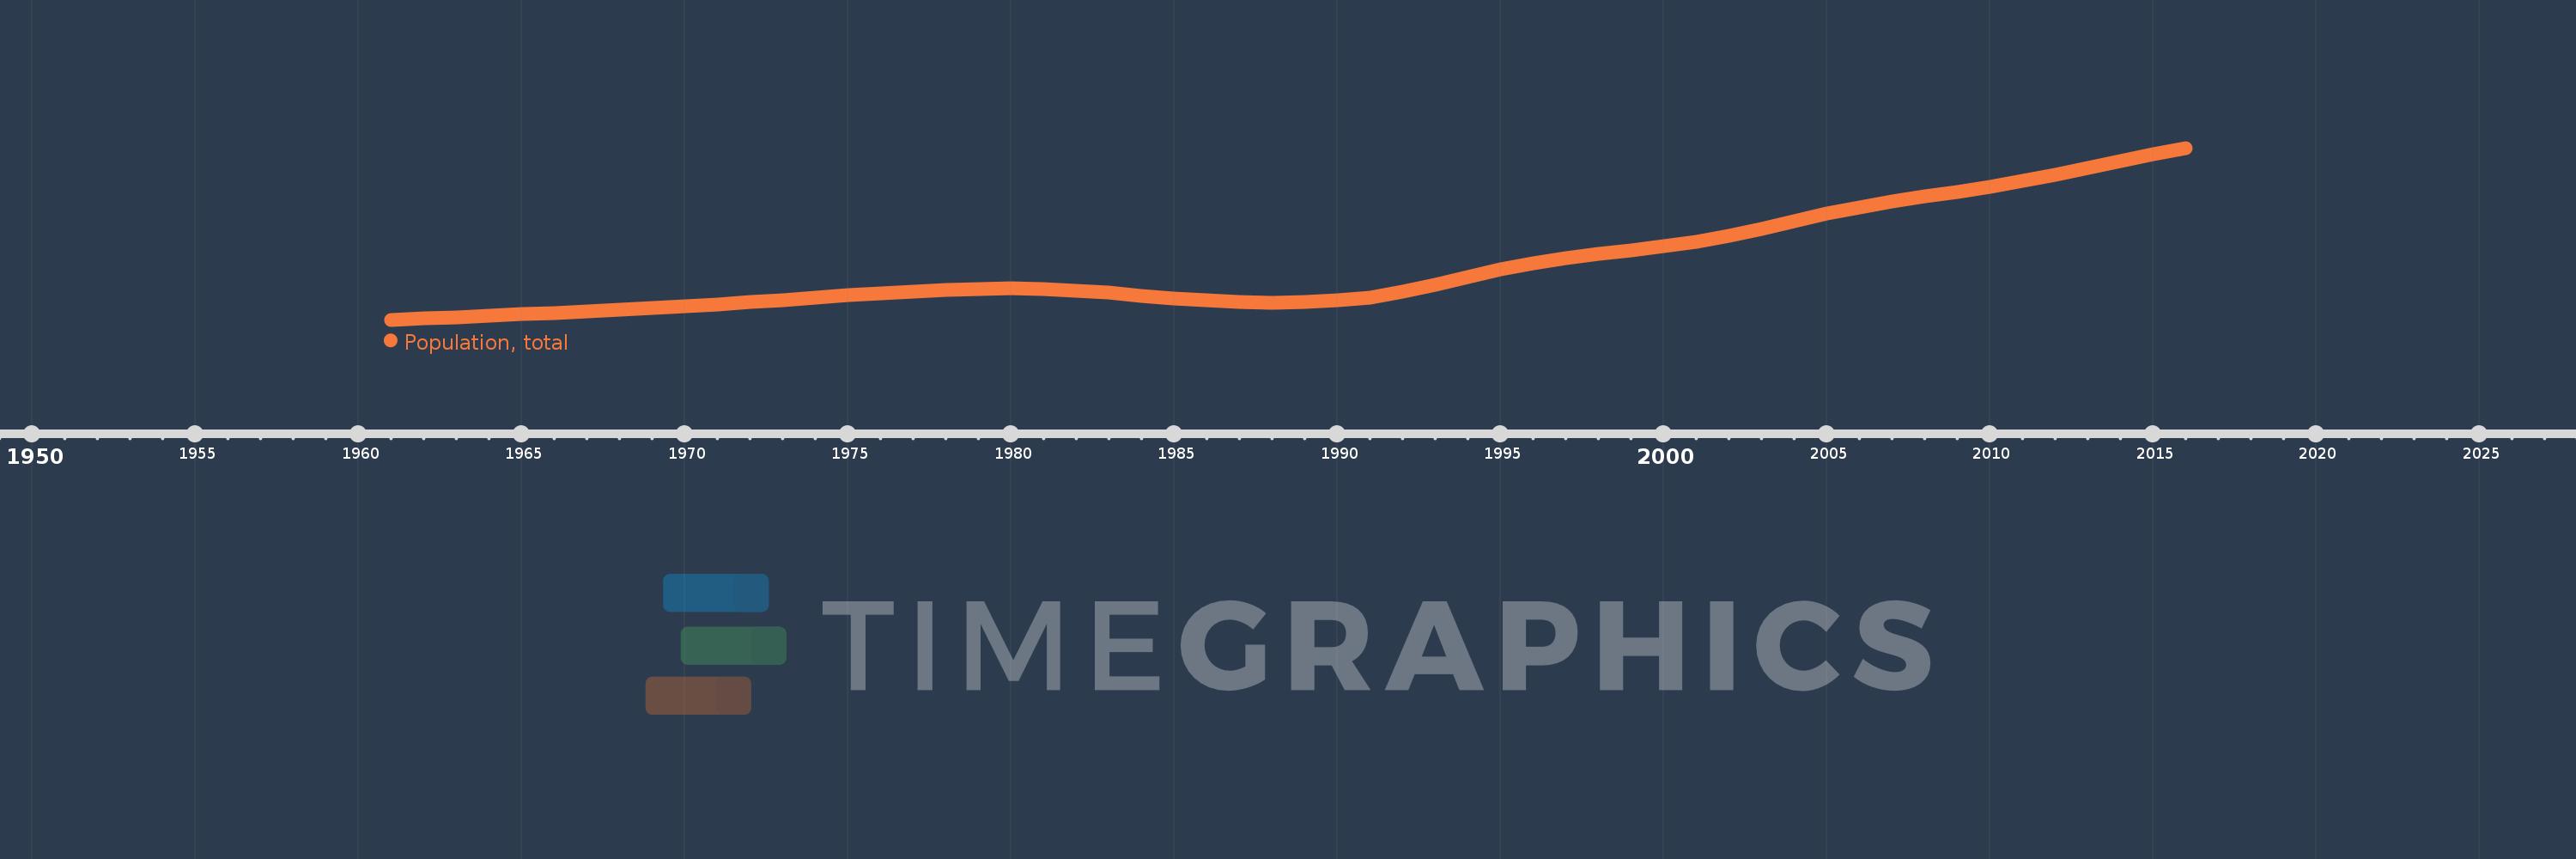
Population, total
2016,2015,2014,2013,2012,2011,2010,2009,2008,2007,2006,2005,2004,2003,2002,2001,2000,1999,1998,1997,1996,1995,1994,1993,1992,1991,1990,1989,1988,1987,1986,1985,1984,1983,1982,1981,1980,1979,1978,1977,1976,1975,1974,1973,1972,1971,1970,1969,1968,1967,1966,1965,1964,1963,1962,1961
This statistics in other country:
AfghanistanAlbaniaAlgeriaAmerican SamoaAndorraAngolaAntigua and BarbudaArab WorldArgentinaArmeniaArubaAustraliaAustriaAzerbaijanBahamas, TheBahrainBangladeshBarbadosBelarusBelgiumBelizeBeninBermudaBhutanBoliviaBosnia and HerzegovinaBotswanaBrazilBritish Virgin IslandsBrunei DarussalamBulgariaBurkina FasoBurundiCabo VerdeCambodiaCameroonCanadaCaribbean small statesCayman IslandsCentral African RepublicCentral Europe and the BalticsChadChannel IslandsChileChinaColombiaComorosCongo, Dem. Rep.Congo, Rep.Costa RicaCote d'IvoireCroatiaCubaCuracaoCyprusCzech RepublicDenmarkDjiboutiDominicaDominican RepublicEarly-demographic dividendEast Asia & PacificEast Asia & Pacific (excluding high income)East Asia & Pacific (IDA & IBRD countries)EcuadorEgypt, Arab Rep.El SalvadorEquatorial GuineaEritreaEstoniaEthiopiaEuro areaEurope & Central AsiaEurope & Central Asia (excluding high income)Europe & Central Asia (IDA & IBRD countries)European UnionFaroe IslandsFijiFinlandFragile and conflict affected situationsFranceFrench PolynesiaGabonGambia, TheGeorgiaGermanyGhanaGibraltarGreeceGreenlandGrenadaGuamGuatemalaGuineaGuinea-BissauGuyanaHaitiHeavily indebted poor countries (HIPC)High incomeHondurasHong Kong SAR, ChinaHungaryIBRD onlyIcelandIDA & IBRD totalIDA blendIDA onlyIDA totalIndiaIndonesiaIran, Islamic Rep.IraqIrelandIsle of ManIsraelItalyJamaicaJapanJordanKazakhstanKenyaKiribatiKorea, Dem. People’s Rep.Korea, Rep.KosovoKuwaitKyrgyz RepublicLao PDRLate-demographic dividendLatin America & Caribbean Latin America & Caribbean (excluding high income)Latin America & the Caribbean (IDA & IBRD countries)LatviaLeast developed countries: UN classificationLebanonLesothoLiberiaLibyaLiechtensteinLithuaniaLow & middle incomeLow incomeLower middle incomeLuxembourgMacao SAR, ChinaMacedonia, FYRMadagascarMalawiMalaysiaMaldivesMaliMaltaMarshall IslandsMauritaniaMauritiusMexicoMicronesia, Fed. Sts.Middle East & North AfricaMiddle East & North Africa (excluding high income)Middle East & North Africa (IDA & IBRD countries)Middle incomeMoldovaMonacoMongoliaMontenegroMoroccoMozambiqueMyanmarNamibiaNauruNepalNetherlandsNew CaledoniaNew ZealandNicaraguaNigerNigeriaNorth AmericaNorthern Mariana IslandsNorwayOECD membersOmanOther small statesPacific island small statesPakistanPalauPanamaPapua New GuineaParaguayPeruPhilippinesPolandPortugalPost-demographic dividendPre-demographic dividendPuerto RicoQatarRomaniaRussian FederationRwandaSamoaSan MarinoSao Tome and PrincipeSaudi ArabiaSenegalSerbiaSeychellesSierra LeoneSingaporeSint Maarten (Dutch part)Slovak RepublicSloveniaSmall statesSolomon IslandsSomaliaSouth AfricaSouth AsiaSouth Asia (IDA & IBRD)South SudanSpainSri LankaSt. Kitts and NevisSt. LuciaSt. Martin (French part)St. Vincent and the GrenadinesSub-Saharan Africa Sub-Saharan Africa (excluding high income)Sub-Saharan Africa (IDA & IBRD countries)SudanSurinameSwazilandSwedenSwitzerlandSyrian Arab RepublicTajikistanTanzaniaThailandTimor-LesteTogoTongaTrinidad and TobagoTunisiaTurkeyTurkmenistanTurks and Caicos IslandsTuvaluUgandaUkraineUnited Arab EmiratesUnited KingdomUnited StatesUpper middle incomeUruguayUzbekistanVanuatuVenezuela, RBVietnamVirgin Islands (U.S.)West Bank and GazaWorldYemen, Rep.ZambiaZimbabwe Timeline:
This timeline shows a graph from 1961 to 2016 of Afghanistan. No data until 1960. Number of actual observations by date: 56.
Source name:
World Development Indicators
Source organization:
(1) United Nations Population Division. World Population Prospects, (2) Census reports and other statistical publications from national statistical offices, (3) Eurostat: Demographic Statistics, (4) United Nations Statistical Division. Population and Vital Statistics Report (various years), (5) U.S. Census Bureau: International Database, and (6) Secretariat of the Pacific Community: Statistics and Demography Programme.
Categories, topics:
Climate Change, Health
Last updated:
apr 23, 2017
Indicators value changes by year
Minimum:
8.995 mln
jan 1, 1961
Maximum:
32.527 mln
jan 1, 2016
At the date of observation
Value
Absolute change
Change from previous value
jan 1, 1961
8.995 mln
+8.995 mln
0.0%
jan 1, 1962
9.165 mln
+170.152K
1.89%
jan 1, 1963
9.344 mln
+178.827K
1.95%
jan 1, 1964
9.532 mln
+187.783K
2.01%
jan 1, 1965
9.729 mln
+197.09K
2.07%
jan 1, 1966
9.935 mln
+206.713K
2.12%
jan 1, 1967
10.149 mln
+213.483K
2.15%
jan 1, 1968
10.369 mln
+219.759K
2.17%
jan 1, 1969
10.6 mln
+231.19K
2.23%
jan 1, 1970
10.85 mln
+249.72K
2.36%
jan 1, 1971
11.121 mln
+271.587K
2.5%
jan 1, 1972
11.413 mln
+291.724K
2.62%
jan 1, 1973
11.717 mln
+304.075K
2.66%
jan 1, 1974
12.023 mln
+305.618K
2.61%
jan 1, 1975
12.316 mln
+293.039K
2.44%
jan 1, 1976
12.583 mln
+267.401K
2.17%
jan 1, 1977
12.831 mln
+248.407K
1.97%
jan 1, 1978
13.056 mln
+225.138K
1.75%
jan 1, 1979
13.223 mln
+166.048K
1.27%
jan 1, 1980
13.283 mln
+60.732K
0.46%
jan 1, 1981
13.211 mln
-71.867K
-0.54%
jan 1, 1982
12.997 mln
-214.489K
-1.62%
jan 1, 1983
12.667 mln
-329.922K
-2.54%
jan 1, 1984
12.279 mln
-387.906K
-3.06%
jan 1, 1985
11.913 mln
-366.585K
-2.99%
jan 1, 1986
11.63 mln
-282.012K
-2.37%
jan 1, 1987
11.439 mln
-191.549K
-1.65%
jan 1, 1988
11.338 mln
-101.017K
-0.88%
jan 1, 1989
11.376 mln
+37.836K
0.33%
jan 1, 1990
11.608 mln
+232.583K
2.04%
jan 1, 1991
12.068 mln
+459.219K
3.96%
jan 1, 1992
12.789 mln
+721.804K
5.98%
jan 1, 1993
13.746 mln
+956.256K
7.48%
jan 1, 1994
14.824 mln
+1.079 mln
7.85%
jan 1, 1995
15.87 mln
+1.046 mln
7.05%
jan 1, 1996
16.773 mln
+902.555K
5.69%
jan 1, 1997
17.482 mln
+709.278K
4.23%
jan 1, 1998
18.034 mln
+552.33K
3.16%
jan 1, 1999
18.511 mln
+477.35K
2.65%
jan 1, 2000
19.038 mln
+526.94K
2.85%
jan 1, 2001
19.702 mln
+663.52K
3.49%
jan 1, 2002
20.531 mln
+829.22K
4.21%
jan 1, 2003
21.487 mln
+955.919K
4.66%
jan 1, 2004
22.507 mln
+1.02 mln
4.75%
jan 1, 2005
23.5 mln
+992.482K
4.41%
jan 1, 2006
24.4 mln
+900.098K
3.83%
jan 1, 2007
25.184 mln
+783.667K
3.21%
jan 1, 2008
25.878 mln
+693.929K
2.76%
jan 1, 2009
26.529 mln
+651.197K
2.52%
jan 1, 2010
27.207 mln
+678.55K
2.56%
jan 1, 2011
27.962 mln
+754.916K
2.77%
jan 1, 2012
28.809 mln
+846.96K
3.03%
jan 1, 2013
29.727 mln
+917.636K
3.19%
jan 1, 2014
30.683 mln
+955.697K
3.21%
jan 1, 2015
31.628 mln
+945.006K
3.08%
jan 1, 2016
32.527 mln
+899.056K
2.84%
Ranking of countries by current statistics by years


Comments: