29
/
en
AIzaSyAYiBZKx7MnpbEhh9jyipgxe19OcubqV5w
April 1, 2024
117324
Cyprus
CYP
true
2
1
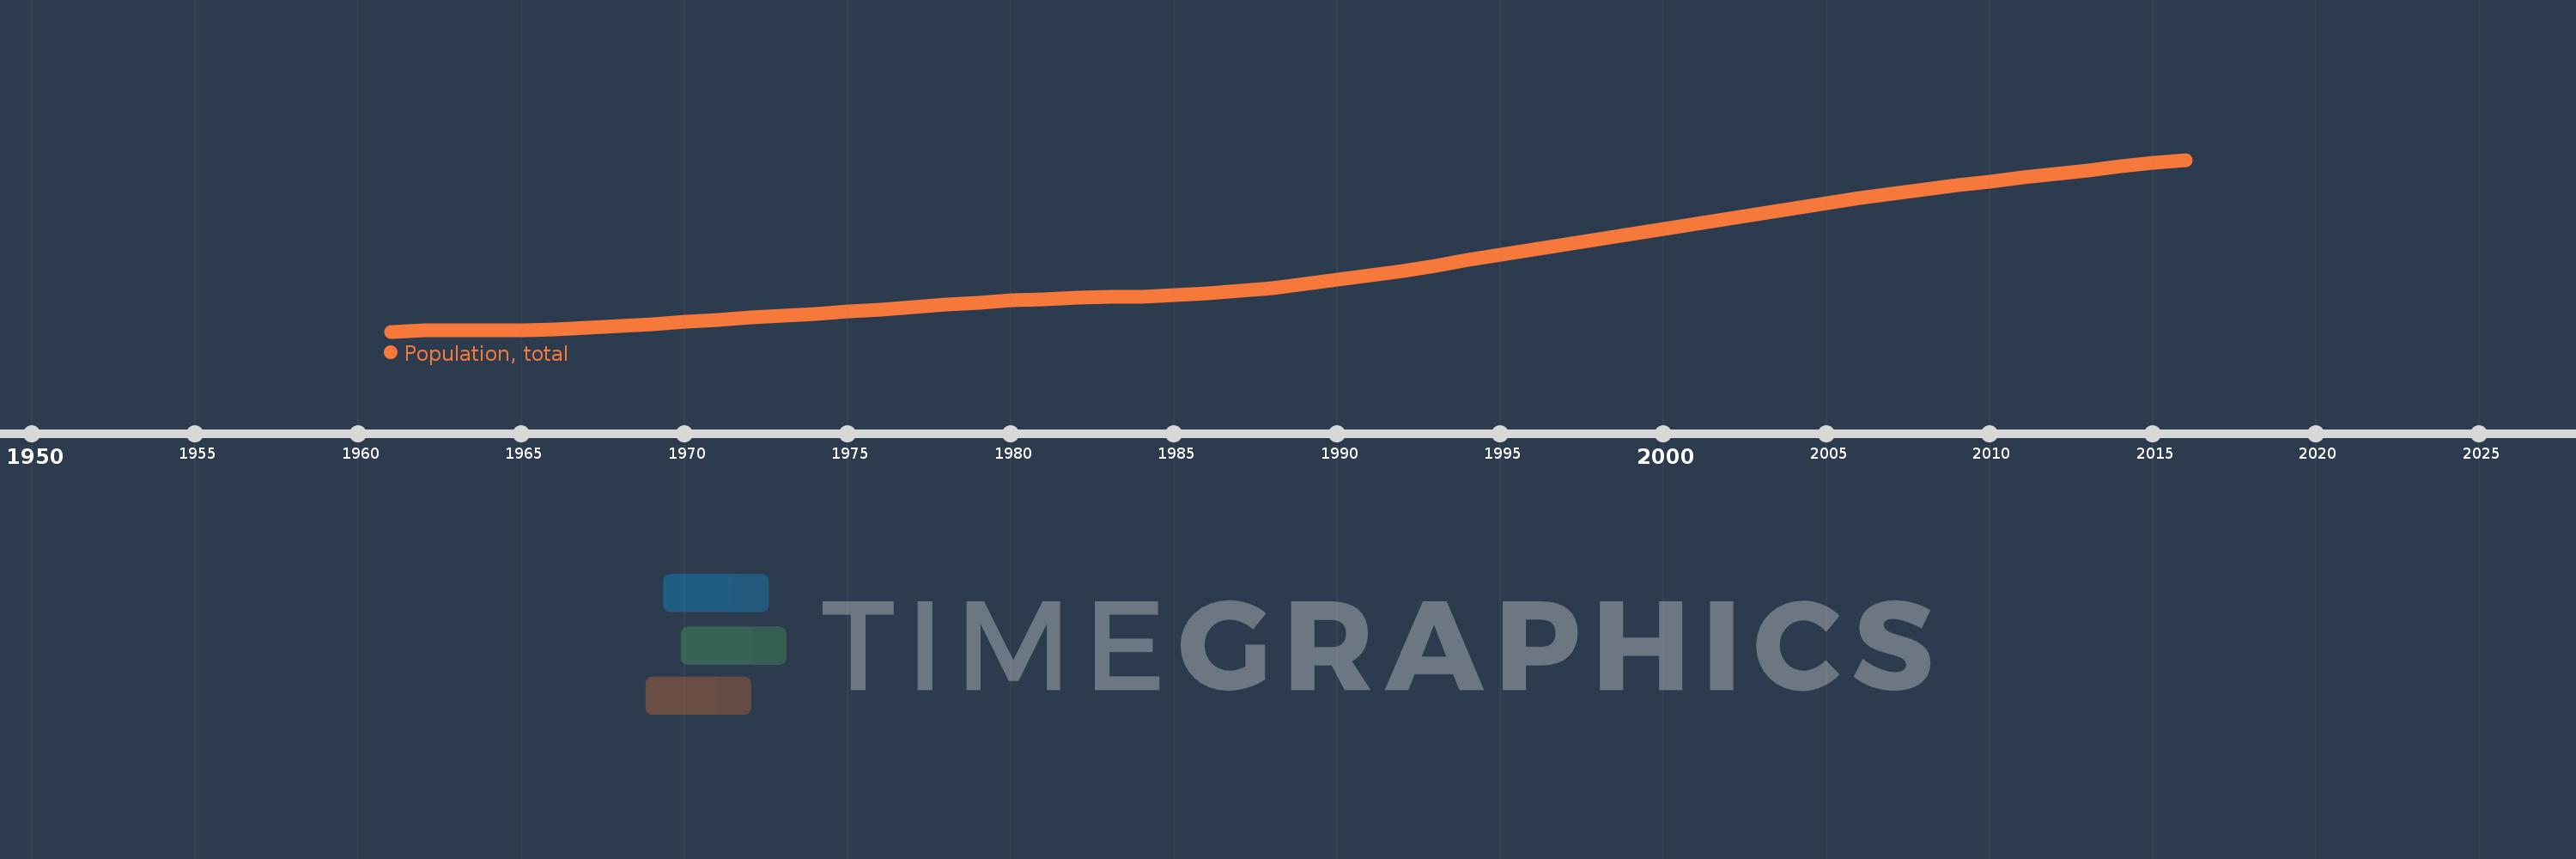
Population, total
2016,2015,2014,2013,2012,2011,2010,2009,2008,2007,2006,2005,2004,2003,2002,2001,2000,1999,1998,1997,1996,1995,1994,1993,1992,1991,1990,1989,1988,1987,1986,1985,1984,1983,1982,1981,1980,1979,1978,1977,1976,1975,1974,1973,1972,1971,1970,1969,1968,1967,1966,1965,1964,1963,1962,1961
This statistics in other country:
AfghanistanAlbaniaAlgeriaAmerican SamoaAndorraAngolaAntigua and BarbudaArab WorldArgentinaArmeniaArubaAustraliaAustriaAzerbaijanBahamas, TheBahrainBangladeshBarbadosBelarusBelgiumBelizeBeninBermudaBhutanBoliviaBosnia and HerzegovinaBotswanaBrazilBritish Virgin IslandsBrunei DarussalamBulgariaBurkina FasoBurundiCabo VerdeCambodiaCameroonCanadaCaribbean small statesCayman IslandsCentral African RepublicCentral Europe and the BalticsChadChannel IslandsChileChinaColombiaComorosCongo, Dem. Rep.Congo, Rep.Costa RicaCote d'IvoireCroatiaCubaCuracaoCyprusCzech RepublicDenmarkDjiboutiDominicaDominican RepublicEarly-demographic dividendEast Asia & PacificEast Asia & Pacific (excluding high income)East Asia & Pacific (IDA & IBRD countries)EcuadorEgypt, Arab Rep.El SalvadorEquatorial GuineaEritreaEstoniaEthiopiaEuro areaEurope & Central AsiaEurope & Central Asia (excluding high income)Europe & Central Asia (IDA & IBRD countries)European UnionFaroe IslandsFijiFinlandFragile and conflict affected situationsFranceFrench PolynesiaGabonGambia, TheGeorgiaGermanyGhanaGibraltarGreeceGreenlandGrenadaGuamGuatemalaGuineaGuinea-BissauGuyanaHaitiHeavily indebted poor countries (HIPC)High incomeHondurasHong Kong SAR, ChinaHungaryIBRD onlyIcelandIDA & IBRD totalIDA blendIDA onlyIDA totalIndiaIndonesiaIran, Islamic Rep.IraqIrelandIsle of ManIsraelItalyJamaicaJapanJordanKazakhstanKenyaKiribatiKorea, Dem. People’s Rep.Korea, Rep.KosovoKuwaitKyrgyz RepublicLao PDRLate-demographic dividendLatin America & Caribbean Latin America & Caribbean (excluding high income)Latin America & the Caribbean (IDA & IBRD countries)LatviaLeast developed countries: UN classificationLebanonLesothoLiberiaLibyaLiechtensteinLithuaniaLow & middle incomeLow incomeLower middle incomeLuxembourgMacao SAR, ChinaMacedonia, FYRMadagascarMalawiMalaysiaMaldivesMaliMaltaMarshall IslandsMauritaniaMauritiusMexicoMicronesia, Fed. Sts.Middle East & North AfricaMiddle East & North Africa (excluding high income)Middle East & North Africa (IDA & IBRD countries)Middle incomeMoldovaMonacoMongoliaMontenegroMoroccoMozambiqueMyanmarNamibiaNauruNepalNetherlandsNew CaledoniaNew ZealandNicaraguaNigerNigeriaNorth AmericaNorthern Mariana IslandsNorwayOECD membersOmanOther small statesPacific island small statesPakistanPalauPanamaPapua New GuineaParaguayPeruPhilippinesPolandPortugalPost-demographic dividendPre-demographic dividendPuerto RicoQatarRomaniaRussian FederationRwandaSamoaSan MarinoSao Tome and PrincipeSaudi ArabiaSenegalSerbiaSeychellesSierra LeoneSingaporeSint Maarten (Dutch part)Slovak RepublicSloveniaSmall statesSolomon IslandsSomaliaSouth AfricaSouth AsiaSouth Asia (IDA & IBRD)South SudanSpainSri LankaSt. Kitts and NevisSt. LuciaSt. Martin (French part)St. Vincent and the GrenadinesSub-Saharan Africa Sub-Saharan Africa (excluding high income)Sub-Saharan Africa (IDA & IBRD countries)SudanSurinameSwazilandSwedenSwitzerlandSyrian Arab RepublicTajikistanTanzaniaThailandTimor-LesteTogoTongaTrinidad and TobagoTunisiaTurkeyTurkmenistanTurks and Caicos IslandsTuvaluUgandaUkraineUnited Arab EmiratesUnited KingdomUnited StatesUpper middle incomeUruguayUzbekistanVanuatuVenezuela, RBVietnamVirgin Islands (U.S.)West Bank and GazaWorldYemen, Rep.ZambiaZimbabwe Timeline:
This timeline shows a graph from 1961 to 2016 of Cyprus. No data until 1960. Number of actual observations by date: 56.
Source name:
World Development Indicators
Source organization:
(1) United Nations Population Division. World Population Prospects, (2) Census reports and other statistical publications from national statistical offices, (3) Eurostat: Demographic Statistics, (4) United Nations Statistical Division. Population and Vital Statistics Report (various years), (5) U.S. Census Bureau: International Database, and (6) Secretariat of the Pacific Community: Statistics and Demography Programme.
Categories, topics:
Climate Change, Health
Last updated:
apr 23, 2017
Indicators value changes by year
Minimum:
572.929K
jan 1, 1961
Maximum:
1.165 mln
jan 1, 2016
At the date of observation
Value
Absolute change
Change from previous value
jan 1, 1961
572.929K
+572.929K
0.0%
jan 1, 1962
576.395K
+3.466K
0.6%
jan 1, 1963
577.691K
+1.296K
0.22%
jan 1, 1964
577.912K
+221.0
0.04%
jan 1, 1965
578.629K
+717.0
0.12%
jan 1, 1966
580.971K
+2.342K
0.4%
jan 1, 1967
585.311K
+4.34K
0.75%
jan 1, 1968
591.304K
+5.993K
1.02%
jan 1, 1969
598.491K
+7.187K
1.22%
jan 1, 1970
606.117K
+7.626K
1.27%
jan 1, 1971
613.619K
+7.502K
1.24%
jan 1, 1972
620.86K
+7.241K
1.18%
jan 1, 1973
628.0K
+7.14K
1.15%
jan 1, 1974
635.109K
+7.109K
1.13%
jan 1, 1975
642.335K
+7.226K
1.14%
jan 1, 1976
649.755K
+7.42K
1.16%
jan 1, 1977
657.526K
+7.771K
1.2%
jan 1, 1978
665.528K
+8.002K
1.22%
jan 1, 1979
673.252K
+7.724K
1.16%
jan 1, 1980
680.013K
+6.761K
1.0%
jan 1, 1981
685.406K
+5.393K
0.79%
jan 1, 1982
689.173K
+3.767K
0.55%
jan 1, 1983
691.711K
+2.538K
0.37%
jan 1, 1984
694.074K
+2.363K
0.34%
jan 1, 1985
697.717K
+3.643K
0.52%
jan 1, 1986
703.693K
+5.976K
0.86%
jan 1, 1987
712.34K
+8.647K
1.23%
jan 1, 1988
723.38K
+11.04K
1.55%
jan 1, 1989
736.477K
+13.097K
1.81%
jan 1, 1990
751.047K
+14.57K
1.98%
jan 1, 1991
766.611K
+15.564K
2.07%
jan 1, 1992
783.138K
+16.527K
2.16%
jan 1, 1993
800.66K
+17.522K
2.24%
jan 1, 1994
818.814K
+18.154K
2.27%
jan 1, 1995
837.166K
+18.352K
2.24%
jan 1, 1996
855.389K
+18.223K
2.18%
jan 1, 1997
873.246K
+17.857K
2.09%
jan 1, 1998
890.733K
+17.487K
2.0%
jan 1, 1999
908.04K
+17.307K
1.94%
jan 1, 2000
925.491K
+17.451K
1.92%
jan 1, 2001
943.287K
+17.796K
1.92%
jan 1, 2002
961.482K
+18.195K
1.93%
jan 1, 2003
979.883K
+18.401K
1.91%
jan 1, 2004
998.15K
+18.267K
1.86%
jan 1, 2005
1.016 mln
+17.677K
1.77%
jan 1, 2006
1.033 mln
+16.759K
1.65%
jan 1, 2007
1.048 mln
+15.707K
1.52%
jan 1, 2008
1.063 mln
+14.747K
1.41%
jan 1, 2009
1.077 mln
+13.97K
1.31%
jan 1, 2010
1.09 mln
+13.476K
1.25%
jan 1, 2011
1.104 mln
+13.199K
1.21%
jan 1, 2012
1.117 mln
+12.959K
1.17%
jan 1, 2013
1.129 mln
+12.659K
1.13%
jan 1, 2014
1.142 mln
+12.349K
1.09%
jan 1, 2015
1.154 mln
+12.006K
1.05%
jan 1, 2016
1.165 mln
+11.642K
1.01%
Ranking of countries by current statistics by years


Comments: