29
/
en
AIzaSyAYiBZKx7MnpbEhh9jyipgxe19OcubqV5w
April 1, 2024
96600
Burundi
BDI
true
2
1
Population, total
2016,2015,2014,2013,2012,2011,2010,2009,2008,2007,2006,2005,2004,2003,2002,2001,2000,1999,1998,1997,1996,1995,1994,1993,1992,1991,1990,1989,1988,1987,1986,1985,1984,1983,1982,1981,1980,1979,1978,1977,1976,1975,1974,1973,1972,1971,1970,1969,1968,1967,1966,1965,1964,1963,1962,1961
This statistics in other country:
AfghanistanAlbaniaAlgeriaAmerican SamoaAndorraAngolaAntigua and BarbudaArab WorldArgentinaArmeniaArubaAustraliaAustriaAzerbaijanBahamas, TheBahrainBangladeshBarbadosBelarusBelgiumBelizeBeninBermudaBhutanBoliviaBosnia and HerzegovinaBotswanaBrazilBritish Virgin IslandsBrunei DarussalamBulgariaBurkina FasoBurundiCabo VerdeCambodiaCameroonCanadaCaribbean small statesCayman IslandsCentral African RepublicCentral Europe and the BalticsChadChannel IslandsChileChinaColombiaComorosCongo, Dem. Rep.Congo, Rep.Costa RicaCote d'IvoireCroatiaCubaCuracaoCyprusCzech RepublicDenmarkDjiboutiDominicaDominican RepublicEarly-demographic dividendEast Asia & PacificEast Asia & Pacific (excluding high income)East Asia & Pacific (IDA & IBRD countries)EcuadorEgypt, Arab Rep.El SalvadorEquatorial GuineaEritreaEstoniaEthiopiaEuro areaEurope & Central AsiaEurope & Central Asia (excluding high income)Europe & Central Asia (IDA & IBRD countries)European UnionFaroe IslandsFijiFinlandFragile and conflict affected situationsFranceFrench PolynesiaGabonGambia, TheGeorgiaGermanyGhanaGibraltarGreeceGreenlandGrenadaGuamGuatemalaGuineaGuinea-BissauGuyanaHaitiHeavily indebted poor countries (HIPC)High incomeHondurasHong Kong SAR, ChinaHungaryIBRD onlyIcelandIDA & IBRD totalIDA blendIDA onlyIDA totalIndiaIndonesiaIran, Islamic Rep.IraqIrelandIsle of ManIsraelItalyJamaicaJapanJordanKazakhstanKenyaKiribatiKorea, Dem. People’s Rep.Korea, Rep.KosovoKuwaitKyrgyz RepublicLao PDRLate-demographic dividendLatin America & Caribbean Latin America & Caribbean (excluding high income)Latin America & the Caribbean (IDA & IBRD countries)LatviaLeast developed countries: UN classificationLebanonLesothoLiberiaLibyaLiechtensteinLithuaniaLow & middle incomeLow incomeLower middle incomeLuxembourgMacao SAR, ChinaMacedonia, FYRMadagascarMalawiMalaysiaMaldivesMaliMaltaMarshall IslandsMauritaniaMauritiusMexicoMicronesia, Fed. Sts.Middle East & North AfricaMiddle East & North Africa (excluding high income)Middle East & North Africa (IDA & IBRD countries)Middle incomeMoldovaMonacoMongoliaMontenegroMoroccoMozambiqueMyanmarNamibiaNauruNepalNetherlandsNew CaledoniaNew ZealandNicaraguaNigerNigeriaNorth AmericaNorthern Mariana IslandsNorwayOECD membersOmanOther small statesPacific island small statesPakistanPalauPanamaPapua New GuineaParaguayPeruPhilippinesPolandPortugalPost-demographic dividendPre-demographic dividendPuerto RicoQatarRomaniaRussian FederationRwandaSamoaSan MarinoSao Tome and PrincipeSaudi ArabiaSenegalSerbiaSeychellesSierra LeoneSingaporeSint Maarten (Dutch part)Slovak RepublicSloveniaSmall statesSolomon IslandsSomaliaSouth AfricaSouth AsiaSouth Asia (IDA & IBRD)South SudanSpainSri LankaSt. Kitts and NevisSt. LuciaSt. Martin (French part)St. Vincent and the GrenadinesSub-Saharan Africa Sub-Saharan Africa (excluding high income)Sub-Saharan Africa (IDA & IBRD countries)SudanSurinameSwazilandSwedenSwitzerlandSyrian Arab RepublicTajikistanTanzaniaThailandTimor-LesteTogoTongaTrinidad and TobagoTunisiaTurkeyTurkmenistanTurks and Caicos IslandsTuvaluUgandaUkraineUnited Arab EmiratesUnited KingdomUnited StatesUpper middle incomeUruguayUzbekistanVanuatuVenezuela, RBVietnamVirgin Islands (U.S.)West Bank and GazaWorldYemen, Rep.ZambiaZimbabwe Timeline:
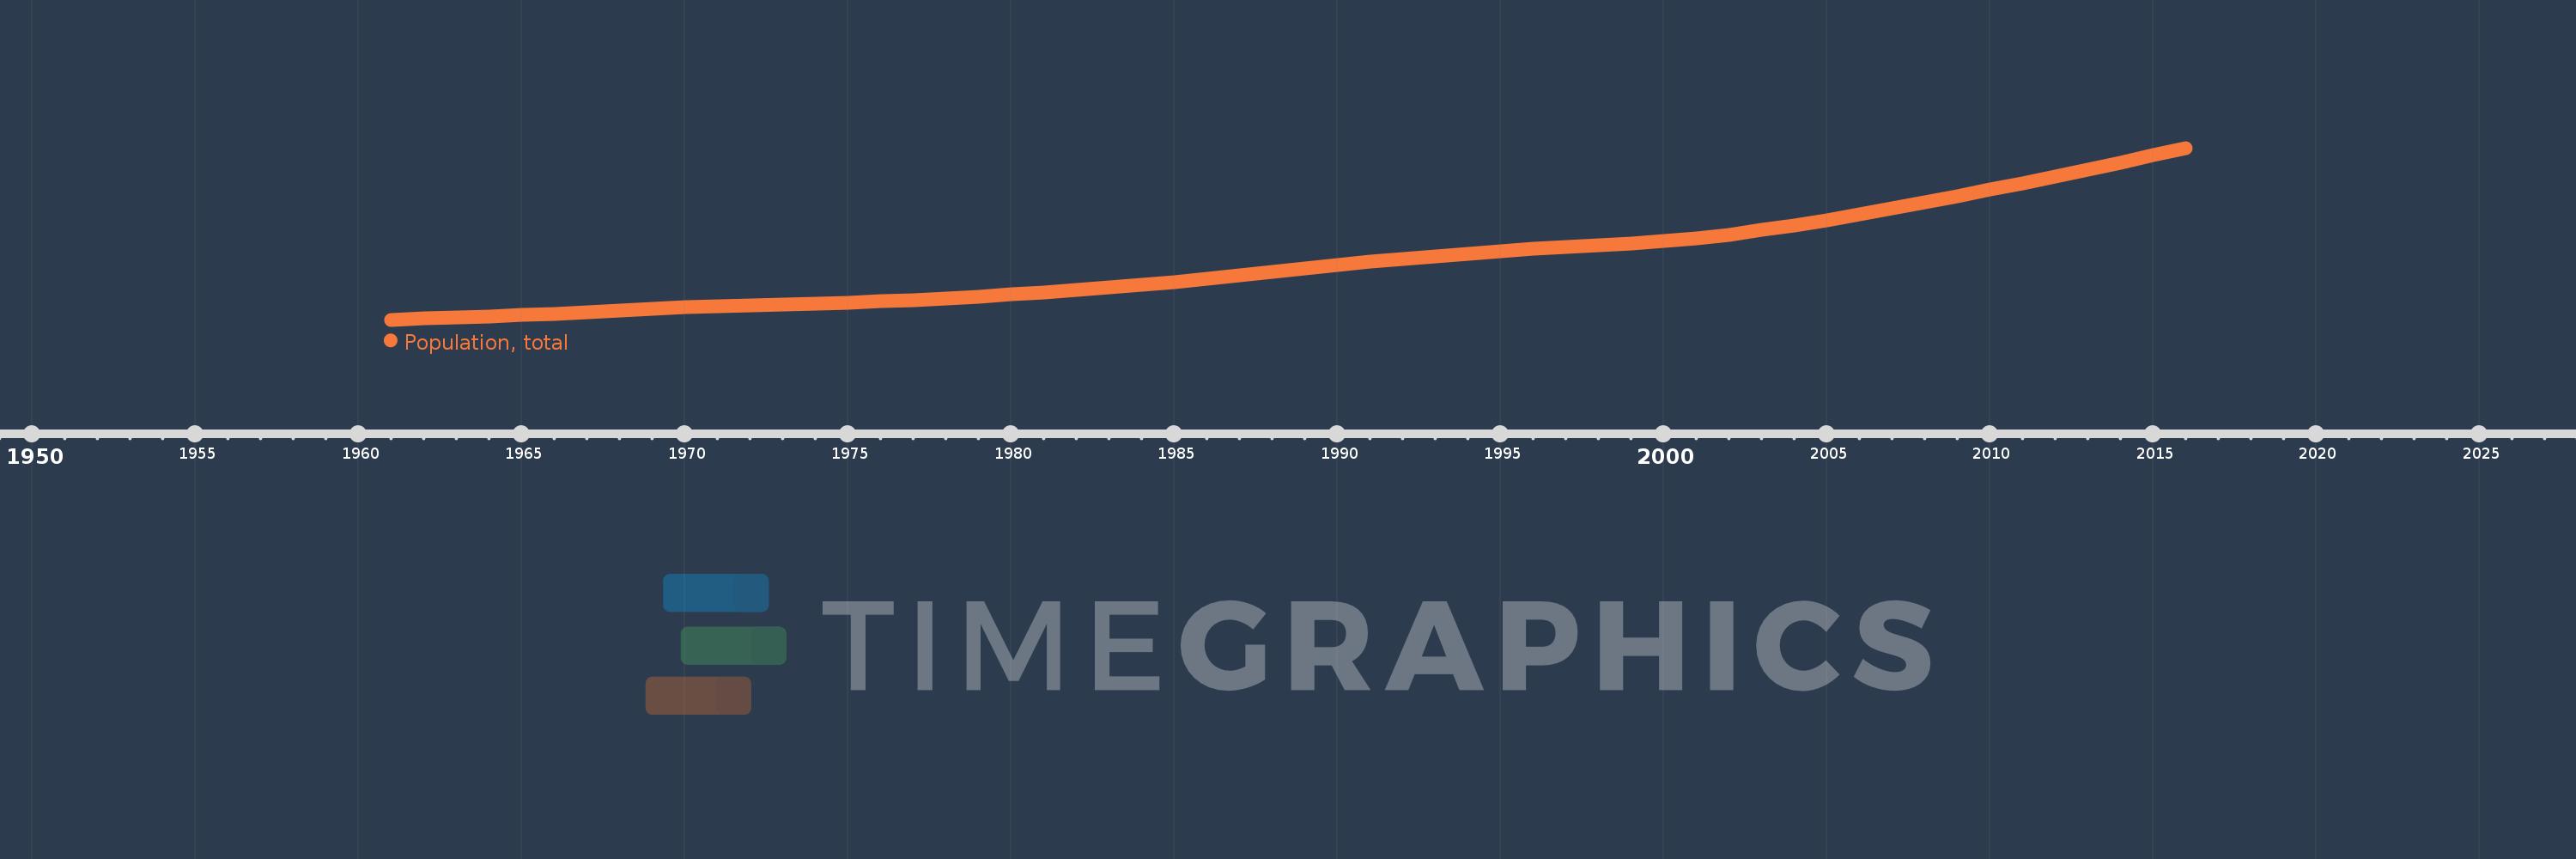
This timeline shows a graph from 1961 to 2016 of Burundi. No data until 1960. Number of actual observations by date: 56.
Source name:
World Development Indicators
Source organization:
(1) United Nations Population Division. World Population Prospects, (2) Census reports and other statistical publications from national statistical offices, (3) Eurostat: Demographic Statistics, (4) United Nations Statistical Division. Population and Vital Statistics Report (various years), (5) U.S. Census Bureau: International Database, and (6) Secretariat of the Pacific Community: Statistics and Demography Programme.
Categories, topics:
Climate Change, Health
Last updated:
apr 23, 2017
Indicators value changes by year
Minimum:
2.787 mln
jan 1, 1961
Maximum:
11.179 mln
jan 1, 2016
At the date of observation
Value
Absolute change
Change from previous value
jan 1, 1961
2.787 mln
+2.787 mln
0.0%
jan 1, 1962
2.84 mln
+53.635K
1.92%
jan 1, 1963
2.895 mln
+54.135K
1.91%
jan 1, 1964
2.951 mln
+56.393K
1.95%
jan 1, 1965
3.012 mln
+61.054K
2.07%
jan 1, 1966
3.079 mln
+67.077K
2.23%
jan 1, 1967
3.154 mln
+74.845K
2.43%
jan 1, 1968
3.235 mln
+81.246K
2.58%
jan 1, 1969
3.317 mln
+82.19K
2.54%
jan 1, 1970
3.393 mln
+75.634K
2.28%
jan 1, 1971
3.457 mln
+64.164K
1.89%
jan 1, 1972
3.508 mln
+50.48K
1.46%
jan 1, 1973
3.547 mln
+39.742K
1.13%
jan 1, 1974
3.583 mln
+35.617K
1.0%
jan 1, 1975
3.624 mln
+40.901K
1.14%
jan 1, 1976
3.677 mln
+53.138K
1.47%
jan 1, 1977
3.745 mln
+67.705K
1.84%
jan 1, 1978
3.825 mln
+80.788K
2.16%
jan 1, 1979
3.918 mln
+92.382K
2.41%
jan 1, 1980
4.019 mln
+101.061K
2.58%
jan 1, 1981
4.127 mln
+107.617K
2.68%
jan 1, 1982
4.24 mln
+113.129K
2.74%
jan 1, 1983
4.359 mln
+119.449K
2.82%
jan 1, 1984
4.487 mln
+127.491K
2.92%
jan 1, 1985
4.625 mln
+138.004K
3.08%
jan 1, 1986
4.774 mln
+149.641K
3.24%
jan 1, 1987
4.936 mln
+162.171K
3.4%
jan 1, 1988
5.109 mln
+172.152K
3.49%
jan 1, 1989
5.284 mln
+175.592K
3.44%
jan 1, 1990
5.454 mln
+170.302K
3.22%
jan 1, 1991
5.613 mln
+158.666K
2.91%
jan 1, 1992
5.759 mln
+146.288K
2.61%
jan 1, 1993
5.895 mln
+135.702K
2.36%
jan 1, 1994
6.02 mln
+124.77K
2.12%
jan 1, 1995
6.134 mln
+114.14K
1.9%
jan 1, 1996
6.239 mln
+104.989K
1.71%
jan 1, 1997
6.333 mln
+94.385K
1.51%
jan 1, 1998
6.42 mln
+86.982K
1.37%
jan 1, 1999
6.512 mln
+91.523K
1.43%
jan 1, 2000
6.624 mln
+111.787K
1.72%
jan 1, 2001
6.767 mln
+143.366K
2.16%
jan 1, 2002
6.947 mln
+179.647K
2.65%
jan 1, 2003
7.16 mln
+213.198K
3.07%
jan 1, 2004
7.401 mln
+241.297K
3.37%
jan 1, 2005
7.662 mln
+260.398K
3.52%
jan 1, 2006
7.934 mln
+272.6K
3.56%
jan 1, 2007
8.218 mln
+283.857K
3.58%
jan 1, 2008
8.515 mln
+296.508K
3.61%
jan 1, 2009
8.822 mln
+307.217K
3.61%
jan 1, 2010
9.138 mln
+315.991K
3.58%
jan 1, 2011
9.461 mln
+323.331K
3.54%
jan 1, 2012
9.79 mln
+329.034K
3.48%
jan 1, 2013
10.125 mln
+334.421K
3.42%
jan 1, 2014
10.466 mln
+341.387K
3.37%
jan 1, 2015
10.817 mln
+350.901K
3.35%
jan 1, 2016
11.179 mln
+362.061K
3.35%
Ranking of countries by current statistics by years


Comments: