29
/
en
AIzaSyAYiBZKx7MnpbEhh9jyipgxe19OcubqV5w
April 1, 2024
283306
Virgin Islands (U.S.)
VIR
true
2
1
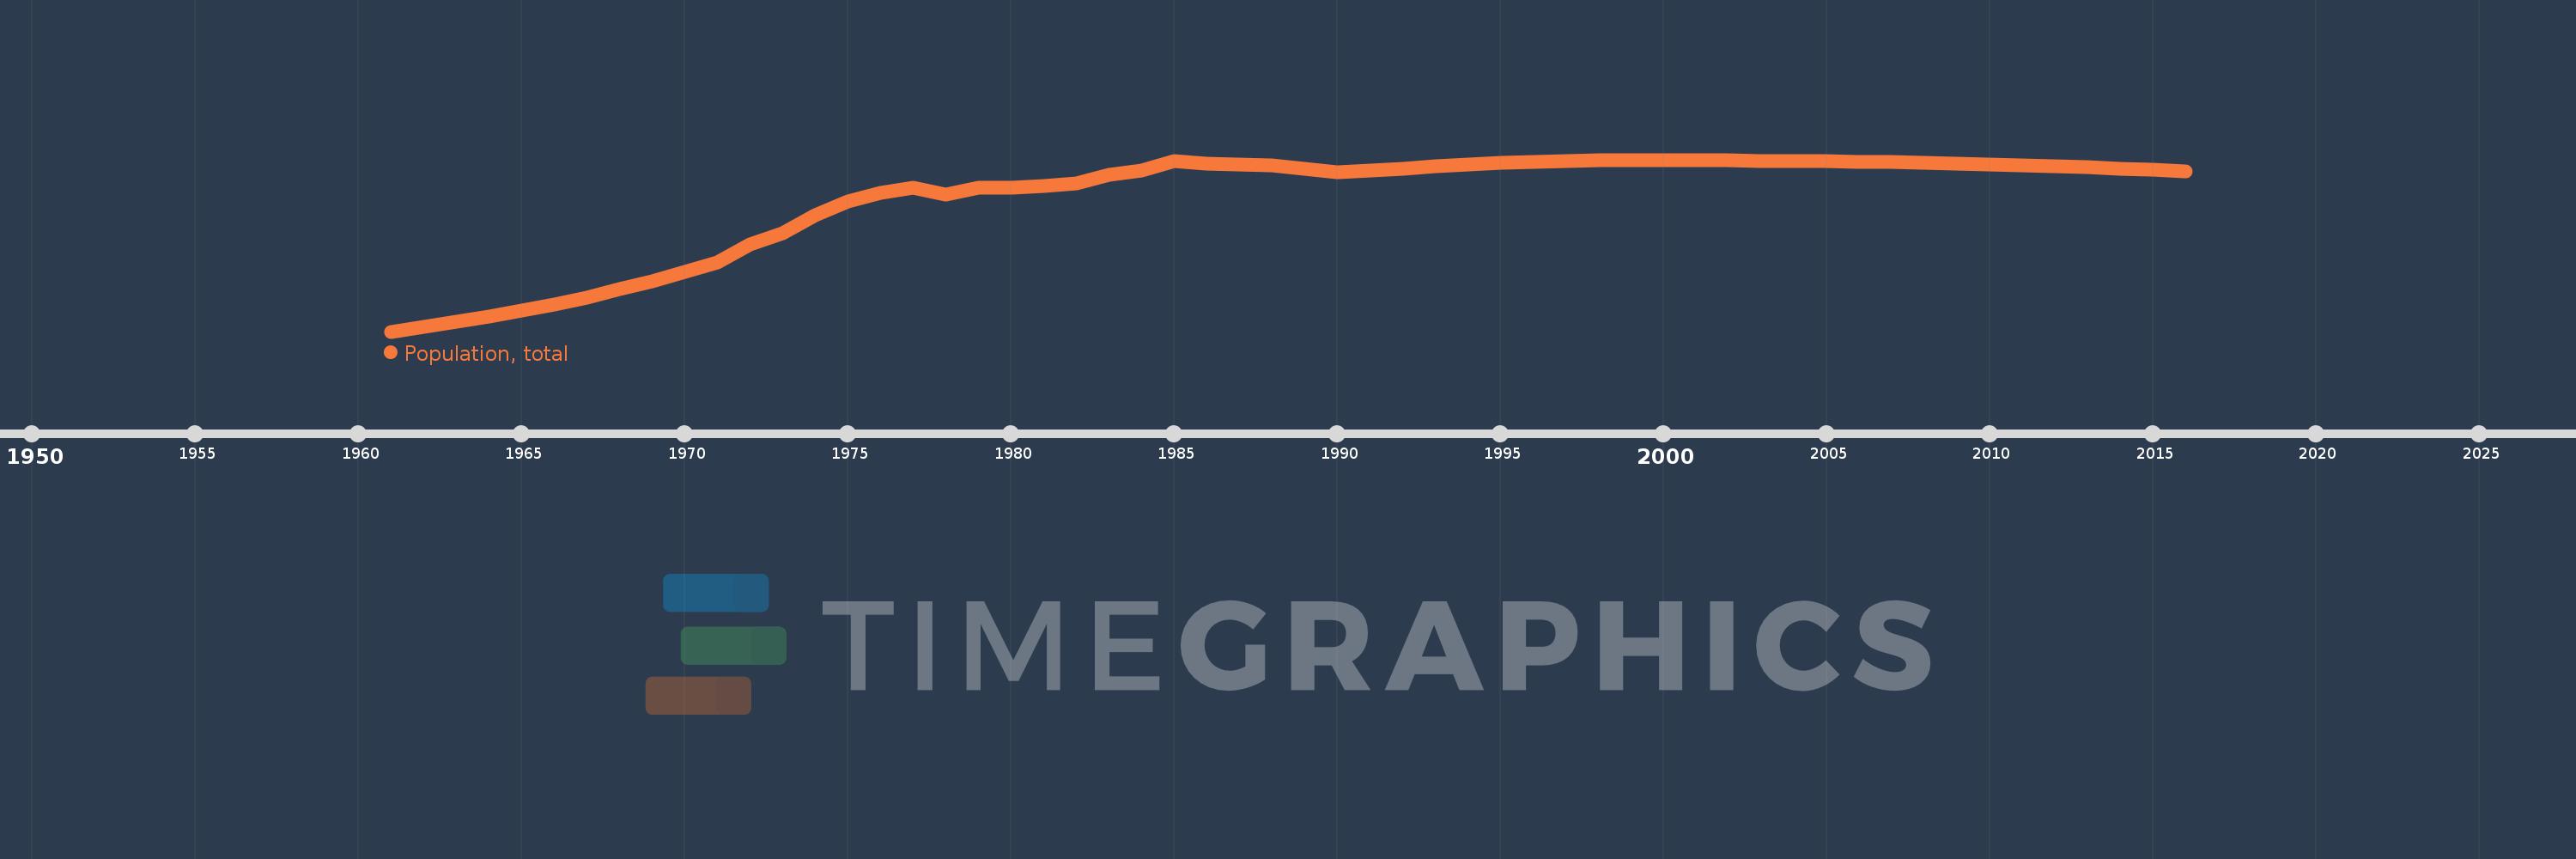
Population, total
2016,2015,2014,2013,2012,2011,2010,2009,2008,2007,2006,2005,2004,2003,2002,2001,2000,1999,1998,1997,1996,1995,1994,1993,1992,1991,1990,1989,1988,1987,1986,1985,1984,1983,1982,1981,1980,1979,1978,1977,1976,1975,1974,1973,1972,1971,1970,1969,1968,1967,1966,1965,1964,1963,1962,1961
This statistics in other country:
AfghanistanAlbaniaAlgeriaAmerican SamoaAndorraAngolaAntigua and BarbudaArab WorldArgentinaArmeniaArubaAustraliaAustriaAzerbaijanBahamas, TheBahrainBangladeshBarbadosBelarusBelgiumBelizeBeninBermudaBhutanBoliviaBosnia and HerzegovinaBotswanaBrazilBritish Virgin IslandsBrunei DarussalamBulgariaBurkina FasoBurundiCabo VerdeCambodiaCameroonCanadaCaribbean small statesCayman IslandsCentral African RepublicCentral Europe and the BalticsChadChannel IslandsChileChinaColombiaComorosCongo, Dem. Rep.Congo, Rep.Costa RicaCote d'IvoireCroatiaCubaCuracaoCyprusCzech RepublicDenmarkDjiboutiDominicaDominican RepublicEarly-demographic dividendEast Asia & PacificEast Asia & Pacific (excluding high income)East Asia & Pacific (IDA & IBRD countries)EcuadorEgypt, Arab Rep.El SalvadorEquatorial GuineaEritreaEstoniaEthiopiaEuro areaEurope & Central AsiaEurope & Central Asia (excluding high income)Europe & Central Asia (IDA & IBRD countries)European UnionFaroe IslandsFijiFinlandFragile and conflict affected situationsFranceFrench PolynesiaGabonGambia, TheGeorgiaGermanyGhanaGibraltarGreeceGreenlandGrenadaGuamGuatemalaGuineaGuinea-BissauGuyanaHaitiHeavily indebted poor countries (HIPC)High incomeHondurasHong Kong SAR, ChinaHungaryIBRD onlyIcelandIDA & IBRD totalIDA blendIDA onlyIDA totalIndiaIndonesiaIran, Islamic Rep.IraqIrelandIsle of ManIsraelItalyJamaicaJapanJordanKazakhstanKenyaKiribatiKorea, Dem. People’s Rep.Korea, Rep.KosovoKuwaitKyrgyz RepublicLao PDRLate-demographic dividendLatin America & Caribbean Latin America & Caribbean (excluding high income)Latin America & the Caribbean (IDA & IBRD countries)LatviaLeast developed countries: UN classificationLebanonLesothoLiberiaLibyaLiechtensteinLithuaniaLow & middle incomeLow incomeLower middle incomeLuxembourgMacao SAR, ChinaMacedonia, FYRMadagascarMalawiMalaysiaMaldivesMaliMaltaMarshall IslandsMauritaniaMauritiusMexicoMicronesia, Fed. Sts.Middle East & North AfricaMiddle East & North Africa (excluding high income)Middle East & North Africa (IDA & IBRD countries)Middle incomeMoldovaMonacoMongoliaMontenegroMoroccoMozambiqueMyanmarNamibiaNauruNepalNetherlandsNew CaledoniaNew ZealandNicaraguaNigerNigeriaNorth AmericaNorthern Mariana IslandsNorwayOECD membersOmanOther small statesPacific island small statesPakistanPalauPanamaPapua New GuineaParaguayPeruPhilippinesPolandPortugalPost-demographic dividendPre-demographic dividendPuerto RicoQatarRomaniaRussian FederationRwandaSamoaSan MarinoSao Tome and PrincipeSaudi ArabiaSenegalSerbiaSeychellesSierra LeoneSingaporeSint Maarten (Dutch part)Slovak RepublicSloveniaSmall statesSolomon IslandsSomaliaSouth AfricaSouth AsiaSouth Asia (IDA & IBRD)South SudanSpainSri LankaSt. Kitts and NevisSt. LuciaSt. Martin (French part)St. Vincent and the GrenadinesSub-Saharan Africa Sub-Saharan Africa (excluding high income)Sub-Saharan Africa (IDA & IBRD countries)SudanSurinameSwazilandSwedenSwitzerlandSyrian Arab RepublicTajikistanTanzaniaThailandTimor-LesteTogoTongaTrinidad and TobagoTunisiaTurkeyTurkmenistanTurks and Caicos IslandsTuvaluUgandaUkraineUnited Arab EmiratesUnited KingdomUnited StatesUpper middle incomeUruguayUzbekistanVanuatuVenezuela, RBVietnamVirgin Islands (U.S.)West Bank and GazaWorldYemen, Rep.ZambiaZimbabwe Timeline:
This timeline shows a graph from 1961 to 2016 of Virgin Islands (U.S.). No data until 1960. Number of actual observations by date: 56.
Source name:
World Development Indicators
Source organization:
(1) United Nations Population Division. World Population Prospects, (2) Census reports and other statistical publications from national statistical offices, (3) Eurostat: Demographic Statistics, (4) United Nations Statistical Division. Population and Vital Statistics Report (various years), (5) U.S. Census Bureau: International Database, and (6) Secretariat of the Pacific Community: Statistics and Demography Programme.
Categories, topics:
Climate Change, Health
Last updated:
apr 23, 2017
Indicators value changes by year
Maximum:
108.639K
jan 1, 2001
At the date of observation
Value
Absolute change
Change from previous value
jan 1, 1961
32.0K
+32.0K
0.0%
jan 1, 1962
34.1K
+2.1K
6.56%
jan 1, 1963
36.3K
+2.2K
6.45%
jan 1, 1964
38.7K
+2.4K
6.61%
jan 1, 1965
41.3K
+2.6K
6.72%
jan 1, 1966
44.0K
+2.7K
6.54%
jan 1, 1967
47.3K
+3.3K
7.5%
jan 1, 1968
50.8K
+3.5K
7.4%
jan 1, 1969
54.6K
+3.8K
7.48%
jan 1, 1970
58.6K
+4.0K
7.33%
jan 1, 1971
63.0K
+4.4K
7.51%
jan 1, 1972
71.0K
+8.0K
12.7%
jan 1, 1973
76.0K
+5.0K
7.04%
jan 1, 1974
84.0K
+8.0K
10.53%
jan 1, 1975
90.0K
+6.0K
7.14%
jan 1, 1976
94.0K
+4.0K
4.44%
jan 1, 1977
96.0K
+2.0K
2.13%
jan 1, 1978
93.0K
-3.0K
-3.13%
jan 1, 1979
96.0K
+3.0K
3.23%
jan 1, 1980
96.0K
0.0
0.0%
jan 1, 1981
97.0K
+1000.0
1.04%
jan 1, 1982
98.0K
+1000.0
1.03%
jan 1, 1983
102.0K
+4.0K
4.08%
jan 1, 1984
104.0K
+2.0K
1.96%
jan 1, 1985
108.0K
+4.0K
3.85%
jan 1, 1986
107.0K
-1000.0
-0.93%
jan 1, 1987
106.5K
-500.0
-0.47%
jan 1, 1988
106.0K
-500.0
-0.47%
jan 1, 1989
104.5K
-1.5K
-1.42%
jan 1, 1990
103.0K
-1.5K
-1.44%
jan 1, 1991
103.963K
+963.0
0.93%
jan 1, 1992
104.807K
+844.0
0.81%
jan 1, 1993
105.711K
+904.0
0.86%
jan 1, 1994
106.577K
+866.0
0.82%
jan 1, 1995
107.317K
+740.0
0.69%
jan 1, 1996
107.817K
+500.0
0.47%
jan 1, 1997
108.093K
+276.0
0.26%
jan 1, 1998
108.355K
+262.0
0.24%
jan 1, 1999
108.535K
+180.0
0.17%
jan 1, 2000
108.596K
+61.0
0.06%
jan 1, 2001
108.639K
+43.0
0.04%
jan 1, 2002
108.386K
-253.0
-0.23%
jan 1, 2003
108.208K
-178.0
-0.16%
jan 1, 2004
108.085K
-123.0
-0.11%
jan 1, 2005
107.95K
-135.0
-0.12%
jan 1, 2006
107.863K
-87.0
-0.08%
jan 1, 2007
107.7K
-163.0
-0.15%
jan 1, 2008
107.423K
-277.0
-0.26%
jan 1, 2009
107.091K
-332.0
-0.31%
jan 1, 2010
106.707K
-384.0
-0.36%
jan 1, 2011
106.267K
-440.0
-0.41%
jan 1, 2012
105.784K
-483.0
-0.45%
jan 1, 2013
105.275K
-509.0
-0.48%
jan 1, 2014
104.737K
-538.0
-0.51%
jan 1, 2015
104.17K
-567.0
-0.54%
jan 1, 2016
103.574K
-596.0
-0.57%
Ranking of countries by current statistics by years


Comments: