29
/
en
AIzaSyAYiBZKx7MnpbEhh9jyipgxe19OcubqV5w
April 1, 2024
38502
IDA blend
IDB
false
2
1
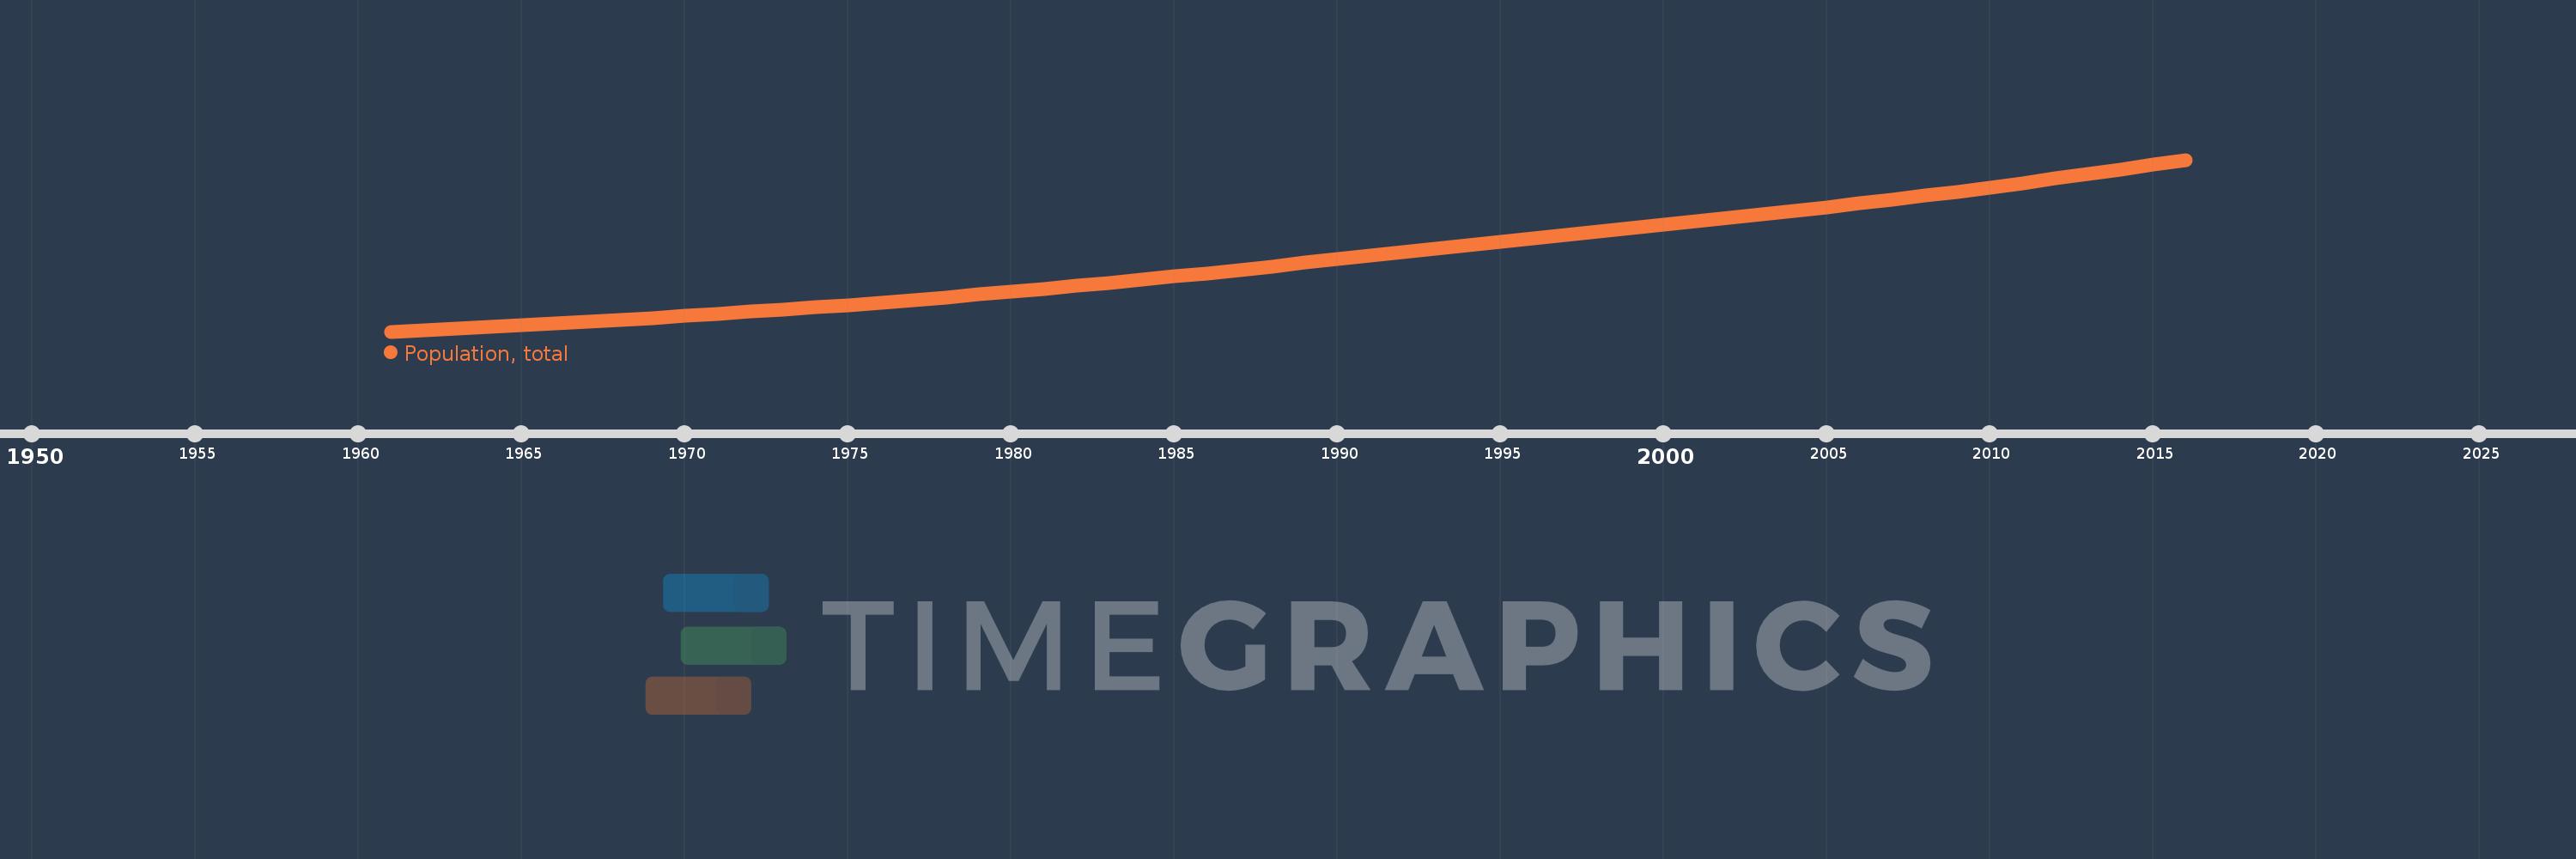
Population, total
2016,2015,2014,2013,2012,2011,2010,2009,2008,2007,2006,2005,2004,2003,2002,2001,2000,1999,1998,1997,1996,1995,1994,1993,1992,1991,1990,1989,1988,1987,1986,1985,1984,1983,1982,1981,1980,1979,1978,1977,1976,1975,1974,1973,1972,1971,1970,1969,1968,1967,1966,1965,1964,1963,1962,1961
This statistics in other country:
AfghanistanAlbaniaAlgeriaAmerican SamoaAndorraAngolaAntigua and BarbudaArab WorldArgentinaArmeniaArubaAustraliaAustriaAzerbaijanBahamas, TheBahrainBangladeshBarbadosBelarusBelgiumBelizeBeninBermudaBhutanBoliviaBosnia and HerzegovinaBotswanaBrazilBritish Virgin IslandsBrunei DarussalamBulgariaBurkina FasoBurundiCabo VerdeCambodiaCameroonCanadaCaribbean small statesCayman IslandsCentral African RepublicCentral Europe and the BalticsChadChannel IslandsChileChinaColombiaComorosCongo, Dem. Rep.Congo, Rep.Costa RicaCote d'IvoireCroatiaCubaCuracaoCyprusCzech RepublicDenmarkDjiboutiDominicaDominican RepublicEarly-demographic dividendEast Asia & PacificEast Asia & Pacific (excluding high income)East Asia & Pacific (IDA & IBRD countries)EcuadorEgypt, Arab Rep.El SalvadorEquatorial GuineaEritreaEstoniaEthiopiaEuro areaEurope & Central AsiaEurope & Central Asia (excluding high income)Europe & Central Asia (IDA & IBRD countries)European UnionFaroe IslandsFijiFinlandFragile and conflict affected situationsFranceFrench PolynesiaGabonGambia, TheGeorgiaGermanyGhanaGibraltarGreeceGreenlandGrenadaGuamGuatemalaGuineaGuinea-BissauGuyanaHaitiHeavily indebted poor countries (HIPC)High incomeHondurasHong Kong SAR, ChinaHungaryIBRD onlyIcelandIDA & IBRD totalIDA blendIDA onlyIDA totalIndiaIndonesiaIran, Islamic Rep.IraqIrelandIsle of ManIsraelItalyJamaicaJapanJordanKazakhstanKenyaKiribatiKorea, Dem. People’s Rep.Korea, Rep.KosovoKuwaitKyrgyz RepublicLao PDRLate-demographic dividendLatin America & Caribbean Latin America & Caribbean (excluding high income)Latin America & the Caribbean (IDA & IBRD countries)LatviaLeast developed countries: UN classificationLebanonLesothoLiberiaLibyaLiechtensteinLithuaniaLow & middle incomeLow incomeLower middle incomeLuxembourgMacao SAR, ChinaMacedonia, FYRMadagascarMalawiMalaysiaMaldivesMaliMaltaMarshall IslandsMauritaniaMauritiusMexicoMicronesia, Fed. Sts.Middle East & North AfricaMiddle East & North Africa (excluding high income)Middle East & North Africa (IDA & IBRD countries)Middle incomeMoldovaMonacoMongoliaMontenegroMoroccoMozambiqueMyanmarNamibiaNauruNepalNetherlandsNew CaledoniaNew ZealandNicaraguaNigerNigeriaNorth AmericaNorthern Mariana IslandsNorwayOECD membersOmanOther small statesPacific island small statesPakistanPalauPanamaPapua New GuineaParaguayPeruPhilippinesPolandPortugalPost-demographic dividendPre-demographic dividendPuerto RicoQatarRomaniaRussian FederationRwandaSamoaSan MarinoSao Tome and PrincipeSaudi ArabiaSenegalSerbiaSeychellesSierra LeoneSingaporeSint Maarten (Dutch part)Slovak RepublicSloveniaSmall statesSolomon IslandsSomaliaSouth AfricaSouth AsiaSouth Asia (IDA & IBRD)South SudanSpainSri LankaSt. Kitts and NevisSt. LuciaSt. Martin (French part)St. Vincent and the GrenadinesSub-Saharan Africa Sub-Saharan Africa (excluding high income)Sub-Saharan Africa (IDA & IBRD countries)SudanSurinameSwazilandSwedenSwitzerlandSyrian Arab RepublicTajikistanTanzaniaThailandTimor-LesteTogoTongaTrinidad and TobagoTunisiaTurkeyTurkmenistanTurks and Caicos IslandsTuvaluUgandaUkraineUnited Arab EmiratesUnited KingdomUnited StatesUpper middle incomeUruguayUzbekistanVanuatuVenezuela, RBVietnamVirgin Islands (U.S.)West Bank and GazaWorldYemen, Rep.ZambiaZimbabwe Timeline:
This timeline shows a graph from 1961 to 2016 of IDA blend. No data until 1960. Number of actual observations by date: 56.
Source name:
World Development Indicators
Source organization:
(1) United Nations Population Division. World Population Prospects, (2) Census reports and other statistical publications from national statistical offices, (3) Eurostat: Demographic Statistics, (4) United Nations Statistical Division. Population and Vital Statistics Report (various years), (5) U.S. Census Bureau: International Database, and (6) Secretariat of the Pacific Community: Statistics and Demography Programme.
Categories, topics:
Climate Change, Health
Last updated:
apr 23, 2017
Indicators value changes by year
Minimum:
163.862 mln
jan 1, 1961
Maximum:
585.76 mln
jan 1, 2016
At the date of observation
Value
Absolute change
Change from previous value
jan 1, 1961
163.862 mln
+163.862 mln
0.0%
jan 1, 1962
167.557 mln
+3.695 mln
2.26%
jan 1, 1963
171.403 mln
+3.845 mln
2.3%
jan 1, 1964
175.257 mln
+3.855 mln
2.25%
jan 1, 1965
179.431 mln
+4.173 mln
2.38%
jan 1, 1966
183.678 mln
+4.247 mln
2.37%
jan 1, 1967
188.078 mln
+4.4 mln
2.4%
jan 1, 1968
192.617 mln
+4.539 mln
2.41%
jan 1, 1969
197.339 mln
+4.722 mln
2.45%
jan 1, 1970
202.204 mln
+4.865 mln
2.47%
jan 1, 1971
207.251 mln
+5.047 mln
2.5%
jan 1, 1972
212.394 mln
+5.143 mln
2.48%
jan 1, 1973
217.715 mln
+5.322 mln
2.51%
jan 1, 1974
223.309 mln
+5.593 mln
2.57%
jan 1, 1975
229.108 mln
+5.799 mln
2.6%
jan 1, 1976
235.185 mln
+6.077 mln
2.65%
jan 1, 1977
241.541 mln
+6.357 mln
2.7%
jan 1, 1978
248.153 mln
+6.612 mln
2.74%
jan 1, 1979
255.016 mln
+6.862 mln
2.77%
jan 1, 1980
262.099 mln
+7.083 mln
2.78%
jan 1, 1981
269.329 mln
+7.23 mln
2.76%
jan 1, 1982
276.43 mln
+7.102 mln
2.64%
jan 1, 1983
283.773 mln
+7.343 mln
2.66%
jan 1, 1984
291.267 mln
+7.494 mln
2.64%
jan 1, 1985
298.993 mln
+7.726 mln
2.65%
jan 1, 1986
307.024 mln
+8.031 mln
2.69%
jan 1, 1987
315.429 mln
+8.405 mln
2.74%
jan 1, 1988
324.102 mln
+8.674 mln
2.75%
jan 1, 1989
332.878 mln
+8.776 mln
2.71%
jan 1, 1990
341.672 mln
+8.793 mln
2.64%
jan 1, 1991
350.16 mln
+8.488 mln
2.48%
jan 1, 1992
358.57 mln
+8.41 mln
2.4%
jan 1, 1993
366.983 mln
+8.414 mln
2.35%
jan 1, 1994
375.375 mln
+8.392 mln
2.29%
jan 1, 1995
383.737 mln
+8.362 mln
2.23%
jan 1, 1996
392.141 mln
+8.404 mln
2.19%
jan 1, 1997
400.675 mln
+8.534 mln
2.18%
jan 1, 1998
409.286 mln
+8.611 mln
2.15%
jan 1, 1999
417.929 mln
+8.643 mln
2.11%
jan 1, 2000
426.493 mln
+8.564 mln
2.05%
jan 1, 2001
435.073 mln
+8.581 mln
2.01%
jan 1, 2002
443.628 mln
+8.555 mln
1.97%
jan 1, 2003
452.158 mln
+8.53 mln
1.92%
jan 1, 2004
460.798 mln
+8.64 mln
1.91%
jan 1, 2005
469.662 mln
+8.864 mln
1.92%
jan 1, 2006
478.749 mln
+9.087 mln
1.93%
jan 1, 2007
488.079 mln
+9.33 mln
1.95%
jan 1, 2008
497.713 mln
+9.634 mln
1.97%
jan 1, 2009
507.661 mln
+9.948 mln
2.0%
jan 1, 2010
517.916 mln
+10.255 mln
2.02%
jan 1, 2011
528.772 mln
+10.856 mln
2.1%
jan 1, 2012
539.941 mln
+11.169 mln
2.11%
jan 1, 2013
551.03 mln
+11.089 mln
2.05%
jan 1, 2014
562.378 mln
+11.348 mln
2.06%
jan 1, 2015
573.991 mln
+11.613 mln
2.07%
jan 1, 2016
585.76 mln
+11.769 mln
2.05%
Ranking of countries by current statistics by years


Comments: