29
/
en
AIzaSyAYiBZKx7MnpbEhh9jyipgxe19OcubqV5w
April 1, 2024
84574
Benin
BEN
true
2
1
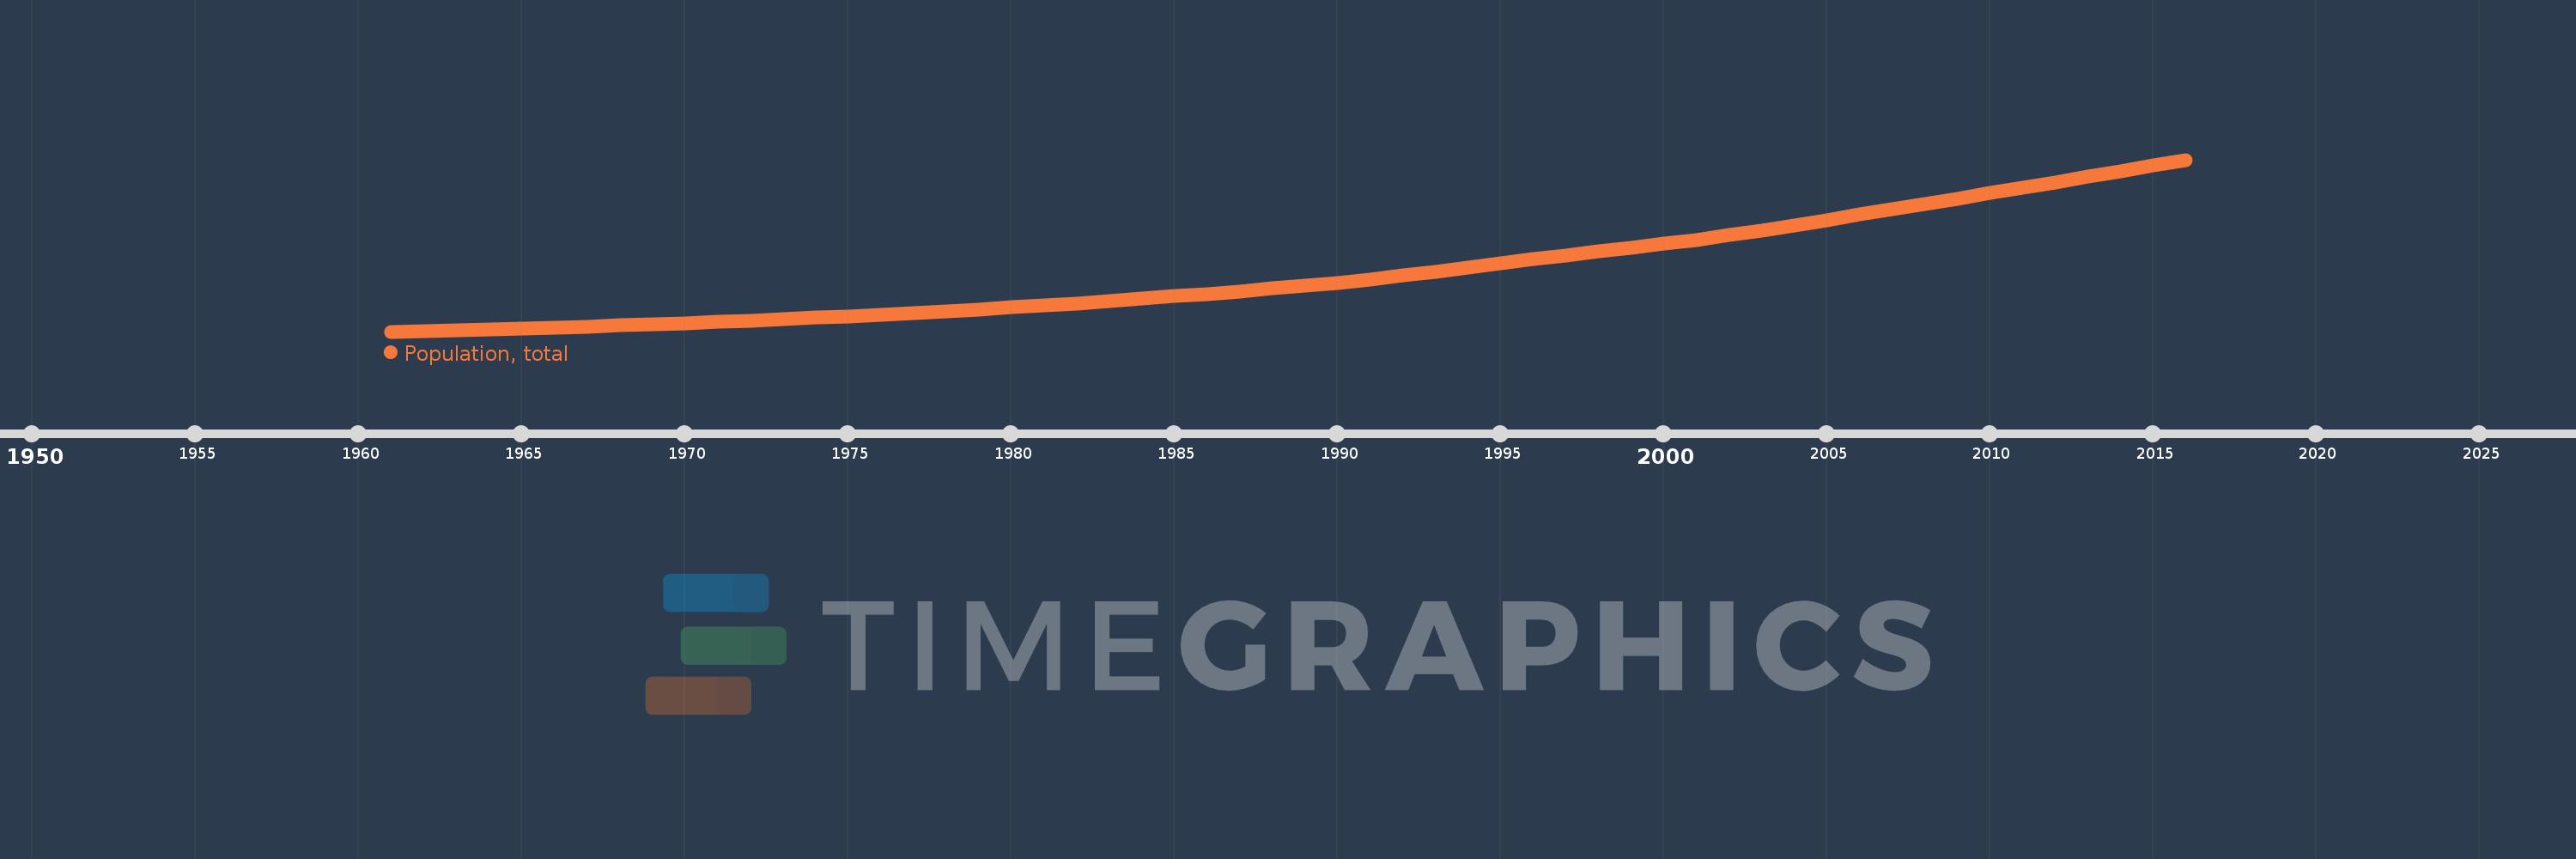
Population, total
2016,2015,2014,2013,2012,2011,2010,2009,2008,2007,2006,2005,2004,2003,2002,2001,2000,1999,1998,1997,1996,1995,1994,1993,1992,1991,1990,1989,1988,1987,1986,1985,1984,1983,1982,1981,1980,1979,1978,1977,1976,1975,1974,1973,1972,1971,1970,1969,1968,1967,1966,1965,1964,1963,1962,1961
This statistics in other country:
AfghanistanAlbaniaAlgeriaAmerican SamoaAndorraAngolaAntigua and BarbudaArab WorldArgentinaArmeniaArubaAustraliaAustriaAzerbaijanBahamas, TheBahrainBangladeshBarbadosBelarusBelgiumBelizeBeninBermudaBhutanBoliviaBosnia and HerzegovinaBotswanaBrazilBritish Virgin IslandsBrunei DarussalamBulgariaBurkina FasoBurundiCabo VerdeCambodiaCameroonCanadaCaribbean small statesCayman IslandsCentral African RepublicCentral Europe and the BalticsChadChannel IslandsChileChinaColombiaComorosCongo, Dem. Rep.Congo, Rep.Costa RicaCote d'IvoireCroatiaCubaCuracaoCyprusCzech RepublicDenmarkDjiboutiDominicaDominican RepublicEarly-demographic dividendEast Asia & PacificEast Asia & Pacific (excluding high income)East Asia & Pacific (IDA & IBRD countries)EcuadorEgypt, Arab Rep.El SalvadorEquatorial GuineaEritreaEstoniaEthiopiaEuro areaEurope & Central AsiaEurope & Central Asia (excluding high income)Europe & Central Asia (IDA & IBRD countries)European UnionFaroe IslandsFijiFinlandFragile and conflict affected situationsFranceFrench PolynesiaGabonGambia, TheGeorgiaGermanyGhanaGibraltarGreeceGreenlandGrenadaGuamGuatemalaGuineaGuinea-BissauGuyanaHaitiHeavily indebted poor countries (HIPC)High incomeHondurasHong Kong SAR, ChinaHungaryIBRD onlyIcelandIDA & IBRD totalIDA blendIDA onlyIDA totalIndiaIndonesiaIran, Islamic Rep.IraqIrelandIsle of ManIsraelItalyJamaicaJapanJordanKazakhstanKenyaKiribatiKorea, Dem. People’s Rep.Korea, Rep.KosovoKuwaitKyrgyz RepublicLao PDRLate-demographic dividendLatin America & Caribbean Latin America & Caribbean (excluding high income)Latin America & the Caribbean (IDA & IBRD countries)LatviaLeast developed countries: UN classificationLebanonLesothoLiberiaLibyaLiechtensteinLithuaniaLow & middle incomeLow incomeLower middle incomeLuxembourgMacao SAR, ChinaMacedonia, FYRMadagascarMalawiMalaysiaMaldivesMaliMaltaMarshall IslandsMauritaniaMauritiusMexicoMicronesia, Fed. Sts.Middle East & North AfricaMiddle East & North Africa (excluding high income)Middle East & North Africa (IDA & IBRD countries)Middle incomeMoldovaMonacoMongoliaMontenegroMoroccoMozambiqueMyanmarNamibiaNauruNepalNetherlandsNew CaledoniaNew ZealandNicaraguaNigerNigeriaNorth AmericaNorthern Mariana IslandsNorwayOECD membersOmanOther small statesPacific island small statesPakistanPalauPanamaPapua New GuineaParaguayPeruPhilippinesPolandPortugalPost-demographic dividendPre-demographic dividendPuerto RicoQatarRomaniaRussian FederationRwandaSamoaSan MarinoSao Tome and PrincipeSaudi ArabiaSenegalSerbiaSeychellesSierra LeoneSingaporeSint Maarten (Dutch part)Slovak RepublicSloveniaSmall statesSolomon IslandsSomaliaSouth AfricaSouth AsiaSouth Asia (IDA & IBRD)South SudanSpainSri LankaSt. Kitts and NevisSt. LuciaSt. Martin (French part)St. Vincent and the GrenadinesSub-Saharan Africa Sub-Saharan Africa (excluding high income)Sub-Saharan Africa (IDA & IBRD countries)SudanSurinameSwazilandSwedenSwitzerlandSyrian Arab RepublicTajikistanTanzaniaThailandTimor-LesteTogoTongaTrinidad and TobagoTunisiaTurkeyTurkmenistanTurks and Caicos IslandsTuvaluUgandaUkraineUnited Arab EmiratesUnited KingdomUnited StatesUpper middle incomeUruguayUzbekistanVanuatuVenezuela, RBVietnamVirgin Islands (U.S.)West Bank and GazaWorldYemen, Rep.ZambiaZimbabwe Timeline:
This timeline shows a graph from 1961 to 2016 of Benin. No data until 1960. Number of actual observations by date: 56.
Source name:
World Development Indicators
Source organization:
(1) United Nations Population Division. World Population Prospects, (2) Census reports and other statistical publications from national statistical offices, (3) Eurostat: Demographic Statistics, (4) United Nations Statistical Division. Population and Vital Statistics Report (various years), (5) U.S. Census Bureau: International Database, and (6) Secretariat of the Pacific Community: Statistics and Demography Programme.
Categories, topics:
Climate Change, Health
Last updated:
apr 23, 2017
Indicators value changes by year
Minimum:
2.432 mln
jan 1, 1961
Maximum:
10.88 mln
jan 1, 2016
At the date of observation
Value
Absolute change
Change from previous value
jan 1, 1961
2.432 mln
+2.432 mln
0.0%
jan 1, 1962
2.466 mln
+34.382K
1.41%
jan 1, 1963
2.503 mln
+37.23K
1.51%
jan 1, 1964
2.543 mln
+40.103K
1.6%
jan 1, 1965
2.586 mln
+43.027K
1.69%
jan 1, 1966
2.632 mln
+45.998K
1.78%
jan 1, 1967
2.681 mln
+49.022K
1.86%
jan 1, 1968
2.733 mln
+52.068K
1.94%
jan 1, 1969
2.789 mln
+55.101K
2.02%
jan 1, 1970
2.847 mln
+58.101K
2.08%
jan 1, 1971
2.908 mln
+61.117K
2.15%
jan 1, 1972
2.972 mln
+64.172K
2.21%
jan 1, 1973
3.039 mln
+67.359K
2.27%
jan 1, 1974
3.11 mln
+70.774K
2.33%
jan 1, 1975
3.185 mln
+74.473K
2.39%
jan 1, 1976
3.263 mln
+78.412K
2.46%
jan 1, 1977
3.346 mln
+82.542K
2.53%
jan 1, 1978
3.432 mln
+86.761K
2.59%
jan 1, 1979
3.523 mln
+91.008K
2.65%
jan 1, 1980
3.619 mln
+95.239K
2.7%
jan 1, 1981
3.718 mln
+99.515K
2.75%
jan 1, 1982
3.822 mln
+104.182K
2.8%
jan 1, 1983
3.931 mln
+109.149K
2.86%
jan 1, 1984
4.045 mln
+113.997K
2.9%
jan 1, 1985
4.164 mln
+118.616K
2.93%
jan 1, 1986
4.287 mln
+123.295K
2.96%
jan 1, 1987
4.414 mln
+127.187K
2.97%
jan 1, 1988
4.546 mln
+131.686K
2.98%
jan 1, 1989
4.685 mln
+139.239K
3.06%
jan 1, 1990
4.836 mln
+150.865K
3.22%
jan 1, 1991
5.001 mln
+165.031K
3.41%
jan 1, 1992
5.183 mln
+181.254K
3.62%
jan 1, 1993
5.378 mln
+195.701K
3.78%
jan 1, 1994
5.582 mln
+204.194K
3.8%
jan 1, 1995
5.787 mln
+204.374K
3.66%
jan 1, 1996
5.986 mln
+198.864K
3.44%
jan 1, 1997
6.176 mln
+190.66K
3.19%
jan 1, 1998
6.361 mln
+184.983K
3.0%
jan 1, 1999
6.546 mln
+185.192K
2.91%
jan 1, 2000
6.74 mln
+193.998K
2.96%
jan 1, 2001
6.949 mln
+208.875K
3.1%
jan 1, 2002
7.175 mln
+225.545K
3.25%
jan 1, 2003
7.415 mln
+239.833K
3.34%
jan 1, 2004
7.666 mln
+250.937K
3.38%
jan 1, 2005
7.923 mln
+257.115K
3.35%
jan 1, 2006
8.182 mln
+259.566K
3.28%
jan 1, 2007
8.444 mln
+261.355K
3.19%
jan 1, 2008
8.708 mln
+263.92K
3.13%
jan 1, 2009
8.974 mln
+265.888K
3.05%
jan 1, 2010
9.241 mln
+267.457K
2.98%
jan 1, 2011
9.51 mln
+268.816K
2.91%
jan 1, 2012
9.779 mln
+269.593K
2.83%
jan 1, 2013
10.05 mln
+270.401K
2.77%
jan 1, 2014
10.322 mln
+272.44K
2.71%
jan 1, 2015
10.598 mln
+276.25K
2.68%
jan 1, 2016
10.88 mln
+281.347K
2.65%
Ranking of countries by current statistics by years


Comments: