29
/
en
AIzaSyAYiBZKx7MnpbEhh9jyipgxe19OcubqV5w
April 1, 2024
196929
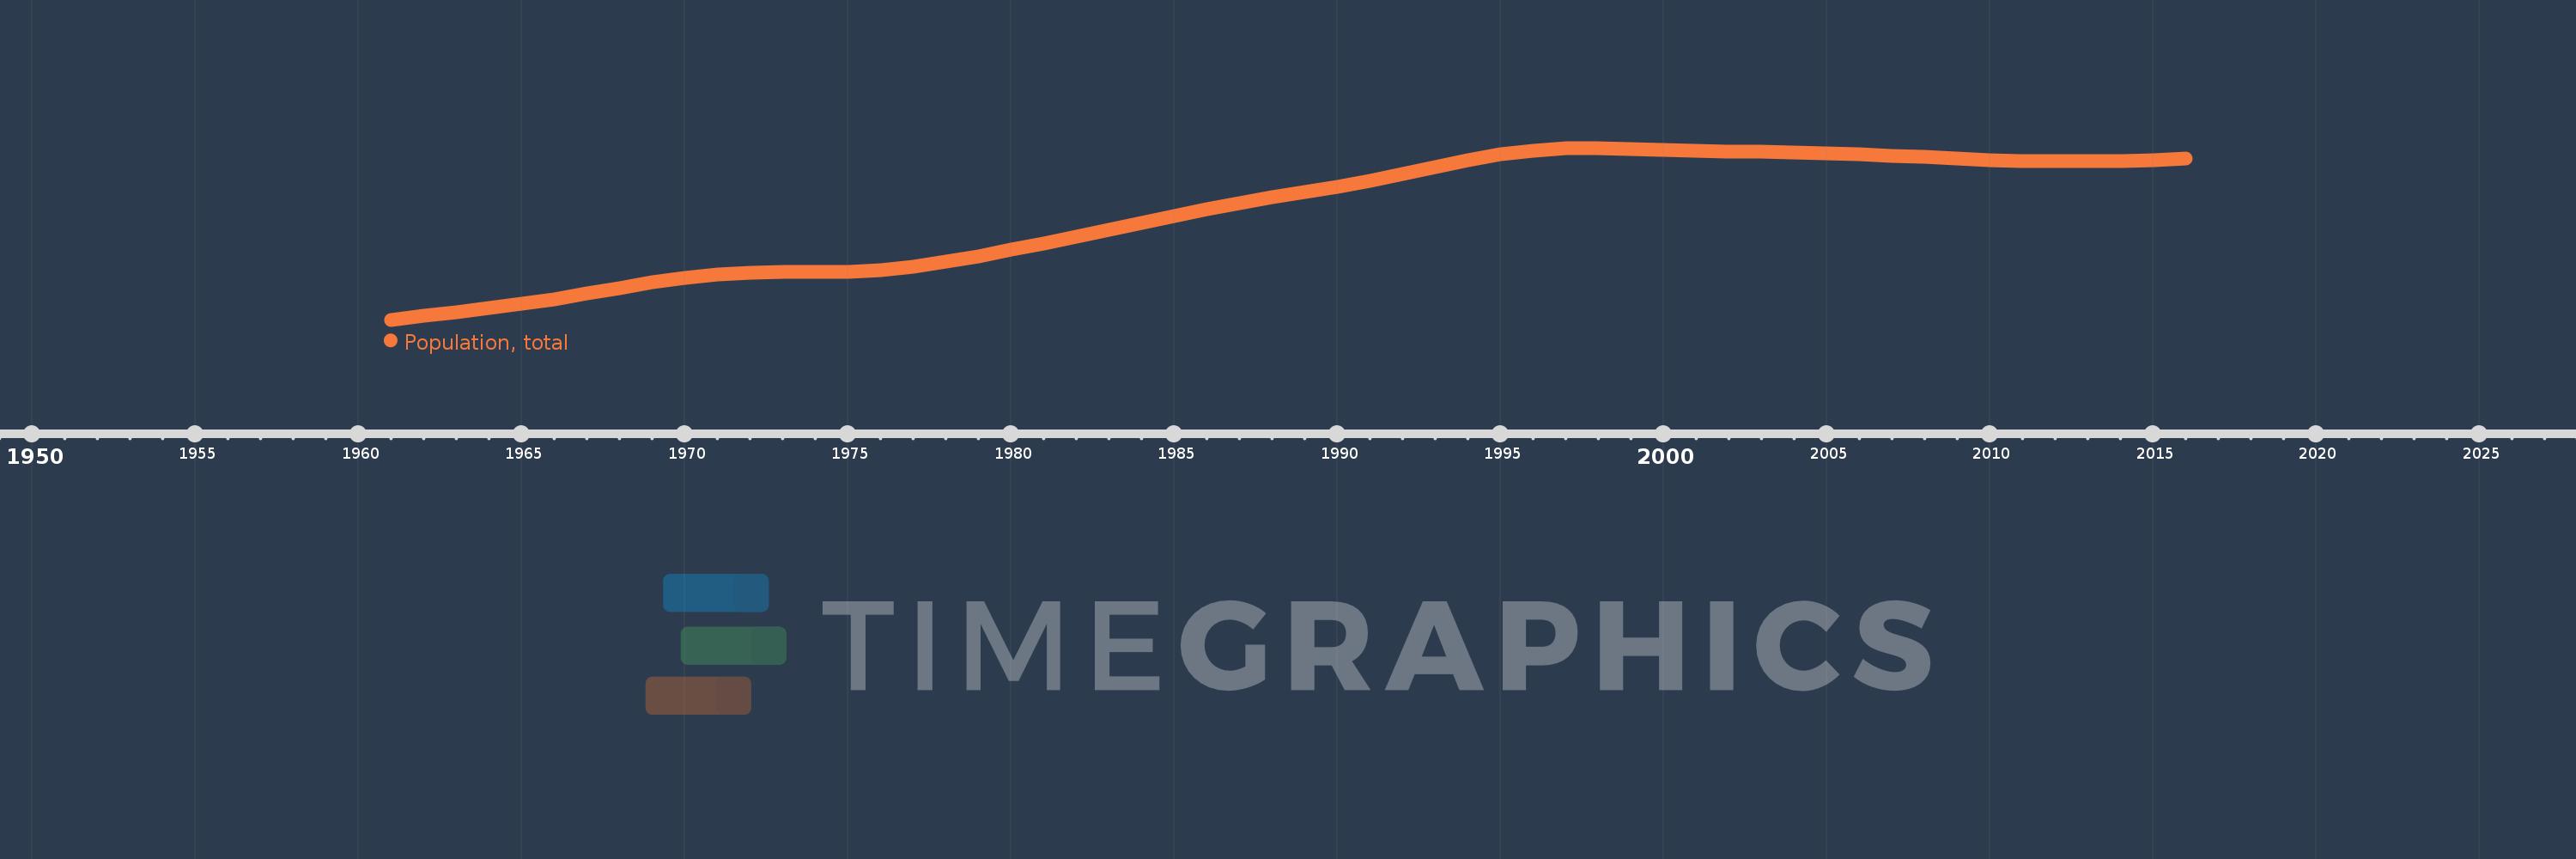
Micronesia, Fed. Sts.
FSM
true
2
1
Population, total
2016,2015,2014,2013,2012,2011,2010,2009,2008,2007,2006,2005,2004,2003,2002,2001,2000,1999,1998,1997,1996,1995,1994,1993,1992,1991,1990,1989,1988,1987,1986,1985,1984,1983,1982,1981,1980,1979,1978,1977,1976,1975,1974,1973,1972,1971,1970,1969,1968,1967,1966,1965,1964,1963,1962,1961
This statistics in other country:
AfghanistanAlbaniaAlgeriaAmerican SamoaAndorraAngolaAntigua and BarbudaArab WorldArgentinaArmeniaArubaAustraliaAustriaAzerbaijanBahamas, TheBahrainBangladeshBarbadosBelarusBelgiumBelizeBeninBermudaBhutanBoliviaBosnia and HerzegovinaBotswanaBrazilBritish Virgin IslandsBrunei DarussalamBulgariaBurkina FasoBurundiCabo VerdeCambodiaCameroonCanadaCaribbean small statesCayman IslandsCentral African RepublicCentral Europe and the BalticsChadChannel IslandsChileChinaColombiaComorosCongo, Dem. Rep.Congo, Rep.Costa RicaCote d'IvoireCroatiaCubaCuracaoCyprusCzech RepublicDenmarkDjiboutiDominicaDominican RepublicEarly-demographic dividendEast Asia & PacificEast Asia & Pacific (excluding high income)East Asia & Pacific (IDA & IBRD countries)EcuadorEgypt, Arab Rep.El SalvadorEquatorial GuineaEritreaEstoniaEthiopiaEuro areaEurope & Central AsiaEurope & Central Asia (excluding high income)Europe & Central Asia (IDA & IBRD countries)European UnionFaroe IslandsFijiFinlandFragile and conflict affected situationsFranceFrench PolynesiaGabonGambia, TheGeorgiaGermanyGhanaGibraltarGreeceGreenlandGrenadaGuamGuatemalaGuineaGuinea-BissauGuyanaHaitiHeavily indebted poor countries (HIPC)High incomeHondurasHong Kong SAR, ChinaHungaryIBRD onlyIcelandIDA & IBRD totalIDA blendIDA onlyIDA totalIndiaIndonesiaIran, Islamic Rep.IraqIrelandIsle of ManIsraelItalyJamaicaJapanJordanKazakhstanKenyaKiribatiKorea, Dem. People’s Rep.Korea, Rep.KosovoKuwaitKyrgyz RepublicLao PDRLate-demographic dividendLatin America & Caribbean Latin America & Caribbean (excluding high income)Latin America & the Caribbean (IDA & IBRD countries)LatviaLeast developed countries: UN classificationLebanonLesothoLiberiaLibyaLiechtensteinLithuaniaLow & middle incomeLow incomeLower middle incomeLuxembourgMacao SAR, ChinaMacedonia, FYRMadagascarMalawiMalaysiaMaldivesMaliMaltaMarshall IslandsMauritaniaMauritiusMexicoMicronesia, Fed. Sts.Middle East & North AfricaMiddle East & North Africa (excluding high income)Middle East & North Africa (IDA & IBRD countries)Middle incomeMoldovaMonacoMongoliaMontenegroMoroccoMozambiqueMyanmarNamibiaNauruNepalNetherlandsNew CaledoniaNew ZealandNicaraguaNigerNigeriaNorth AmericaNorthern Mariana IslandsNorwayOECD membersOmanOther small statesPacific island small statesPakistanPalauPanamaPapua New GuineaParaguayPeruPhilippinesPolandPortugalPost-demographic dividendPre-demographic dividendPuerto RicoQatarRomaniaRussian FederationRwandaSamoaSan MarinoSao Tome and PrincipeSaudi ArabiaSenegalSerbiaSeychellesSierra LeoneSingaporeSint Maarten (Dutch part)Slovak RepublicSloveniaSmall statesSolomon IslandsSomaliaSouth AfricaSouth AsiaSouth Asia (IDA & IBRD)South SudanSpainSri LankaSt. Kitts and NevisSt. LuciaSt. Martin (French part)St. Vincent and the GrenadinesSub-Saharan Africa Sub-Saharan Africa (excluding high income)Sub-Saharan Africa (IDA & IBRD countries)SudanSurinameSwazilandSwedenSwitzerlandSyrian Arab RepublicTajikistanTanzaniaThailandTimor-LesteTogoTongaTrinidad and TobagoTunisiaTurkeyTurkmenistanTurks and Caicos IslandsTuvaluUgandaUkraineUnited Arab EmiratesUnited KingdomUnited StatesUpper middle incomeUruguayUzbekistanVanuatuVenezuela, RBVietnamVirgin Islands (U.S.)West Bank and GazaWorldYemen, Rep.ZambiaZimbabwe Timeline:
This timeline shows a graph from 1961 to 2016 of Micronesia, Fed. Sts.. No data until 1960. Number of actual observations by date: 56.
Source name:
World Development Indicators
Source organization:
(1) United Nations Population Division. World Population Prospects, (2) Census reports and other statistical publications from national statistical offices, (3) Eurostat: Demographic Statistics, (4) United Nations Statistical Division. Population and Vital Statistics Report (various years), (5) U.S. Census Bureau: International Database, and (6) Secretariat of the Pacific Community: Statistics and Demography Programme.
Categories, topics:
Climate Change, Health
Last updated:
apr 23, 2017
Indicators value changes by year
Minimum:
44.539K
jan 1, 1961
Maximum:
108.506K
jan 1, 1998
At the date of observation
Value
Absolute change
Change from previous value
jan 1, 1961
44.539K
+44.539K
0.0%
jan 1, 1962
45.956K
+1.417K
3.18%
jan 1, 1963
47.387K
+1.431K
3.11%
jan 1, 1964
48.875K
+1.488K
3.14%
jan 1, 1965
50.483K
+1.608K
3.29%
jan 1, 1966
52.238K
+1.755K
3.48%
jan 1, 1967
54.201K
+1.963K
3.76%
jan 1, 1968
56.324K
+2.123K
3.92%
jan 1, 1969
58.404K
+2.08K
3.69%
jan 1, 1970
60.167K
+1.763K
3.02%
jan 1, 1971
61.433K
+1.266K
2.1%
jan 1, 1972
62.107K
+674.0
1.1%
jan 1, 1973
62.298K
+191.0
0.31%
jan 1, 1974
62.289K
-9.0
-0.01%
jan 1, 1975
62.477K
+188.0
0.3%
jan 1, 1976
63.146K
+669.0
1.07%
jan 1, 1977
64.386K
+1.24K
1.96%
jan 1, 1978
66.11K
+1.724K
2.68%
jan 1, 1979
68.221K
+2.111K
3.19%
jan 1, 1980
70.55K
+2.329K
3.41%
jan 1, 1981
72.967K
+2.417K
3.43%
jan 1, 1982
75.462K
+2.495K
3.42%
jan 1, 1983
78.057K
+2.595K
3.44%
jan 1, 1984
80.678K
+2.621K
3.36%
jan 1, 1985
83.242K
+2.564K
3.18%
jan 1, 1986
85.689K
+2.447K
2.94%
jan 1, 1987
87.948K
+2.259K
2.64%
jan 1, 1988
90.024K
+2.076K
2.36%
jan 1, 1989
92.02K
+1.996K
2.22%
jan 1, 1990
94.091K
+2.071K
2.25%
jan 1, 1991
96.331K
+2.24K
2.38%
jan 1, 1992
98.8K
+2.469K
2.56%
jan 1, 1993
101.412K
+2.612K
2.64%
jan 1, 1994
103.937K
+2.525K
2.49%
jan 1, 1995
106.057K
+2.12K
2.04%
jan 1, 1996
107.556K
+1.499K
1.41%
jan 1, 1997
108.342K
+786.0
0.73%
jan 1, 1998
108.506K
+164.0
0.15%
jan 1, 1999
108.236K
-270.0
-0.25%
jan 1, 2000
107.808K
-428.0
-0.4%
jan 1, 2001
107.43K
-378.0
-0.35%
jan 1, 2002
107.17K
-260.0
-0.24%
jan 1, 2003
106.983K
-187.0
-0.17%
jan 1, 2004
106.816K
-167.0
-0.16%
jan 1, 2005
106.575K
-241.0
-0.23%
jan 1, 2006
106.198K
-377.0
-0.35%
jan 1, 2007
105.68K
-518.0
-0.49%
jan 1, 2008
105.08K
-600.0
-0.57%
jan 1, 2009
104.472K
-608.0
-0.58%
jan 1, 2010
103.961K
-511.0
-0.49%
jan 1, 2011
103.619K
-342.0
-0.33%
jan 1, 2012
103.476K
-143.0
-0.14%
jan 1, 2013
103.516K
+40.0
0.04%
jan 1, 2014
103.718K
+202.0
0.2%
jan 1, 2015
104.044K
+326.0
0.31%
jan 1, 2016
104.46K
+416.0
0.4%
Ranking of countries by current statistics by years


Comments: