29
/
en
AIzaSyAYiBZKx7MnpbEhh9jyipgxe19OcubqV5w
April 1, 2024
258798
Syrian Arab Republic
SYR
true
2
1
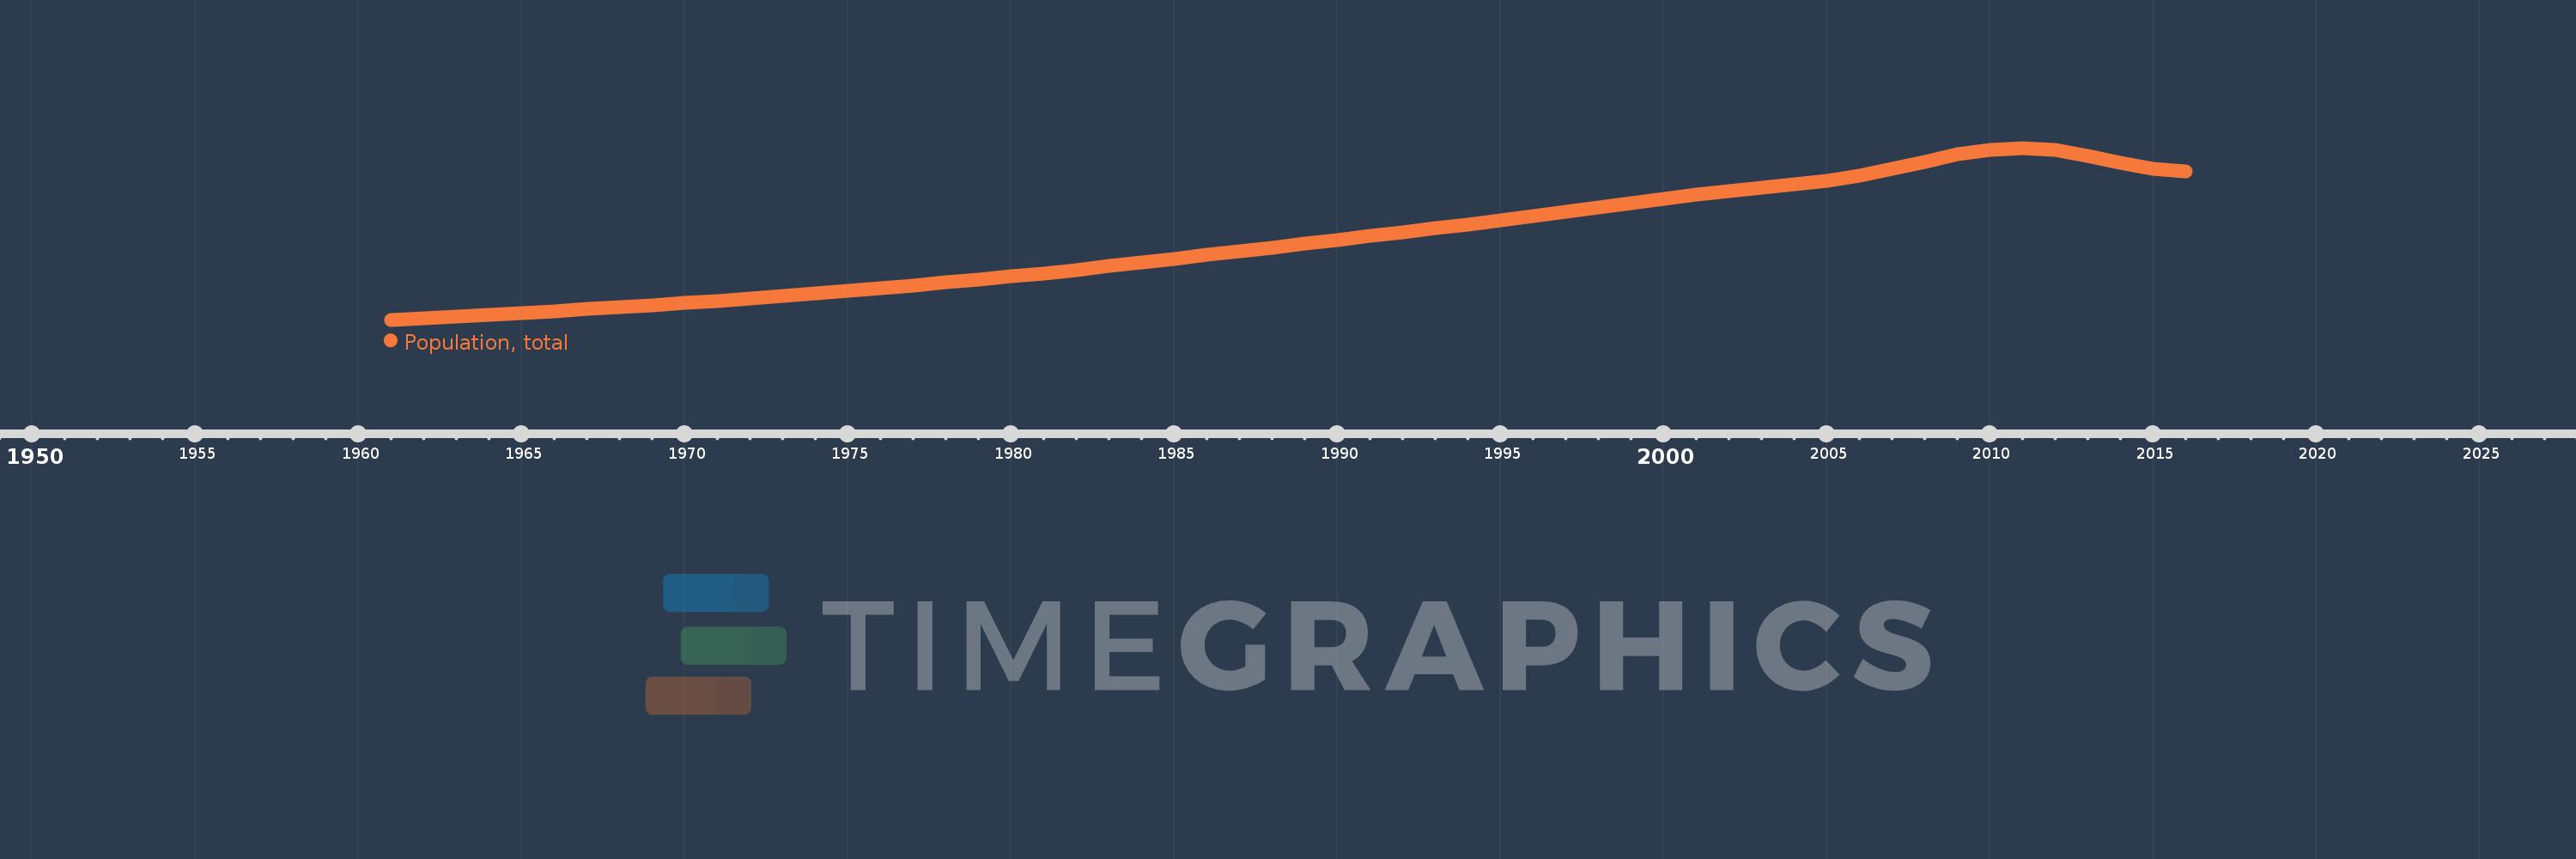
Population, total
2016,2015,2014,2013,2012,2011,2010,2009,2008,2007,2006,2005,2004,2003,2002,2001,2000,1999,1998,1997,1996,1995,1994,1993,1992,1991,1990,1989,1988,1987,1986,1985,1984,1983,1982,1981,1980,1979,1978,1977,1976,1975,1974,1973,1972,1971,1970,1969,1968,1967,1966,1965,1964,1963,1962,1961
This statistics in other country:
AfghanistanAlbaniaAlgeriaAmerican SamoaAndorraAngolaAntigua and BarbudaArab WorldArgentinaArmeniaArubaAustraliaAustriaAzerbaijanBahamas, TheBahrainBangladeshBarbadosBelarusBelgiumBelizeBeninBermudaBhutanBoliviaBosnia and HerzegovinaBotswanaBrazilBritish Virgin IslandsBrunei DarussalamBulgariaBurkina FasoBurundiCabo VerdeCambodiaCameroonCanadaCaribbean small statesCayman IslandsCentral African RepublicCentral Europe and the BalticsChadChannel IslandsChileChinaColombiaComorosCongo, Dem. Rep.Congo, Rep.Costa RicaCote d'IvoireCroatiaCubaCuracaoCyprusCzech RepublicDenmarkDjiboutiDominicaDominican RepublicEarly-demographic dividendEast Asia & PacificEast Asia & Pacific (excluding high income)East Asia & Pacific (IDA & IBRD countries)EcuadorEgypt, Arab Rep.El SalvadorEquatorial GuineaEritreaEstoniaEthiopiaEuro areaEurope & Central AsiaEurope & Central Asia (excluding high income)Europe & Central Asia (IDA & IBRD countries)European UnionFaroe IslandsFijiFinlandFragile and conflict affected situationsFranceFrench PolynesiaGabonGambia, TheGeorgiaGermanyGhanaGibraltarGreeceGreenlandGrenadaGuamGuatemalaGuineaGuinea-BissauGuyanaHaitiHeavily indebted poor countries (HIPC)High incomeHondurasHong Kong SAR, ChinaHungaryIBRD onlyIcelandIDA & IBRD totalIDA blendIDA onlyIDA totalIndiaIndonesiaIran, Islamic Rep.IraqIrelandIsle of ManIsraelItalyJamaicaJapanJordanKazakhstanKenyaKiribatiKorea, Dem. People’s Rep.Korea, Rep.KosovoKuwaitKyrgyz RepublicLao PDRLate-demographic dividendLatin America & Caribbean Latin America & Caribbean (excluding high income)Latin America & the Caribbean (IDA & IBRD countries)LatviaLeast developed countries: UN classificationLebanonLesothoLiberiaLibyaLiechtensteinLithuaniaLow & middle incomeLow incomeLower middle incomeLuxembourgMacao SAR, ChinaMacedonia, FYRMadagascarMalawiMalaysiaMaldivesMaliMaltaMarshall IslandsMauritaniaMauritiusMexicoMicronesia, Fed. Sts.Middle East & North AfricaMiddle East & North Africa (excluding high income)Middle East & North Africa (IDA & IBRD countries)Middle incomeMoldovaMonacoMongoliaMontenegroMoroccoMozambiqueMyanmarNamibiaNauruNepalNetherlandsNew CaledoniaNew ZealandNicaraguaNigerNigeriaNorth AmericaNorthern Mariana IslandsNorwayOECD membersOmanOther small statesPacific island small statesPakistanPalauPanamaPapua New GuineaParaguayPeruPhilippinesPolandPortugalPost-demographic dividendPre-demographic dividendPuerto RicoQatarRomaniaRussian FederationRwandaSamoaSan MarinoSao Tome and PrincipeSaudi ArabiaSenegalSerbiaSeychellesSierra LeoneSingaporeSint Maarten (Dutch part)Slovak RepublicSloveniaSmall statesSolomon IslandsSomaliaSouth AfricaSouth AsiaSouth Asia (IDA & IBRD)South SudanSpainSri LankaSt. Kitts and NevisSt. LuciaSt. Martin (French part)St. Vincent and the GrenadinesSub-Saharan Africa Sub-Saharan Africa (excluding high income)Sub-Saharan Africa (IDA & IBRD countries)SudanSurinameSwazilandSwedenSwitzerlandSyrian Arab RepublicTajikistanTanzaniaThailandTimor-LesteTogoTongaTrinidad and TobagoTunisiaTurkeyTurkmenistanTurks and Caicos IslandsTuvaluUgandaUkraineUnited Arab EmiratesUnited KingdomUnited StatesUpper middle incomeUruguayUzbekistanVanuatuVenezuela, RBVietnamVirgin Islands (U.S.)West Bank and GazaWorldYemen, Rep.ZambiaZimbabwe Timeline:
This timeline shows a graph from 1961 to 2016 of Syrian Arab Republic. No data until 1960. Number of actual observations by date: 56.
Source name:
World Development Indicators
Source organization:
(1) United Nations Population Division. World Population Prospects, (2) Census reports and other statistical publications from national statistical offices, (3) Eurostat: Demographic Statistics, (4) United Nations Statistical Division. Population and Vital Statistics Report (various years), (5) U.S. Census Bureau: International Database, and (6) Secretariat of the Pacific Community: Statistics and Demography Programme.
Categories, topics:
Climate Change, Health
Last updated:
apr 23, 2017
Indicators value changes by year
Minimum:
4.593 mln
jan 1, 1961
Maximum:
20.721 mln
jan 1, 2011
At the date of observation
Value
Absolute change
Change from previous value
jan 1, 1961
4.593 mln
+4.593 mln
0.0%
jan 1, 1962
4.743 mln
+149.819K
3.26%
jan 1, 1963
4.897 mln
+154.832K
3.26%
jan 1, 1964
5.058 mln
+160.397K
3.28%
jan 1, 1965
5.225 mln
+166.754K
3.3%
jan 1, 1966
5.398 mln
+173.754K
3.33%
jan 1, 1967
5.579 mln
+180.95K
3.35%
jan 1, 1968
5.767 mln
+188.195K
3.37%
jan 1, 1969
5.963 mln
+195.77K
3.39%
jan 1, 1970
6.167 mln
+203.685K
3.42%
jan 1, 1971
6.379 mln
+211.869K
3.44%
jan 1, 1972
6.599 mln
+220.564K
3.46%
jan 1, 1973
6.829 mln
+229.399K
3.48%
jan 1, 1974
7.066 mln
+237.709K
3.48%
jan 1, 1975
7.312 mln
+245.211K
3.47%
jan 1, 1976
7.564 mln
+252.315K
3.45%
jan 1, 1977
7.823 mln
+258.61K
3.42%
jan 1, 1978
8.088 mln
+265.538K
3.39%
jan 1, 1979
8.363 mln
+275.198K
3.4%
jan 1, 1980
8.652 mln
+288.558K
3.45%
jan 1, 1981
8.956 mln
+304.252K
3.52%
jan 1, 1982
9.277 mln
+321.107K
3.59%
jan 1, 1983
9.614 mln
+336.254K
3.62%
jan 1, 1984
9.961 mln
+347.316K
3.61%
jan 1, 1985
10.313 mln
+352.652K
3.54%
jan 1, 1986
10.667 mln
+353.76K
3.43%
jan 1, 1987
11.021 mln
+353.473K
3.31%
jan 1, 1988
11.375 mln
+354.054K
3.21%
jan 1, 1989
11.73 mln
+355.445K
3.12%
jan 1, 1990
12.089 mln
+358.497K
3.06%
jan 1, 1991
12.452 mln
+362.825K
3.0%
jan 1, 1992
12.818 mln
+366.039K
2.94%
jan 1, 1993
13.186 mln
+368.609K
2.88%
jan 1, 1994
13.56 mln
+373.455K
2.83%
jan 1, 1995
13.941 mln
+381.383K
2.81%
jan 1, 1996
14.332 mln
+390.937K
2.8%
jan 1, 1997
14.736 mln
+404.247K
2.82%
jan 1, 1998
15.152 mln
+415.753K
2.82%
jan 1, 1999
15.569 mln
+416.835K
2.75%
jan 1, 2000
15.972 mln
+403.633K
2.59%
jan 1, 2001
16.354 mln
+381.62K
2.39%
jan 1, 2002
16.694 mln
+340.364K
2.08%
jan 1, 2003
16.998 mln
+303.107K
1.82%
jan 1, 2004
17.304 mln
+306.818K
1.81%
jan 1, 2005
17.672 mln
+367.574K
2.12%
jan 1, 2006
18.133 mln
+460.929K
2.61%
jan 1, 2007
18.728 mln
+595.358K
3.28%
jan 1, 2008
19.426 mln
+697.397K
3.72%
jan 1, 2009
20.097 mln
+671.46K
3.46%
jan 1, 2010
20.567 mln
+469.814K
2.34%
jan 1, 2011
20.721 mln
+153.731K
0.75%
jan 1, 2012
20.501 mln
-219.435K
-1.06%
jan 1, 2013
19.979 mln
-522.411K
-2.55%
jan 1, 2014
19.323 mln
-656.163K
-3.28%
jan 1, 2015
18.772 mln
-550.112K
-2.85%
jan 1, 2016
18.502 mln
-270.068K
-1.44%
Ranking of countries by current statistics by years


Comments: