29
/
en
AIzaSyAYiBZKx7MnpbEhh9jyipgxe19OcubqV5w
April 1, 2024
152970
Hungary
HUN
true
2
1
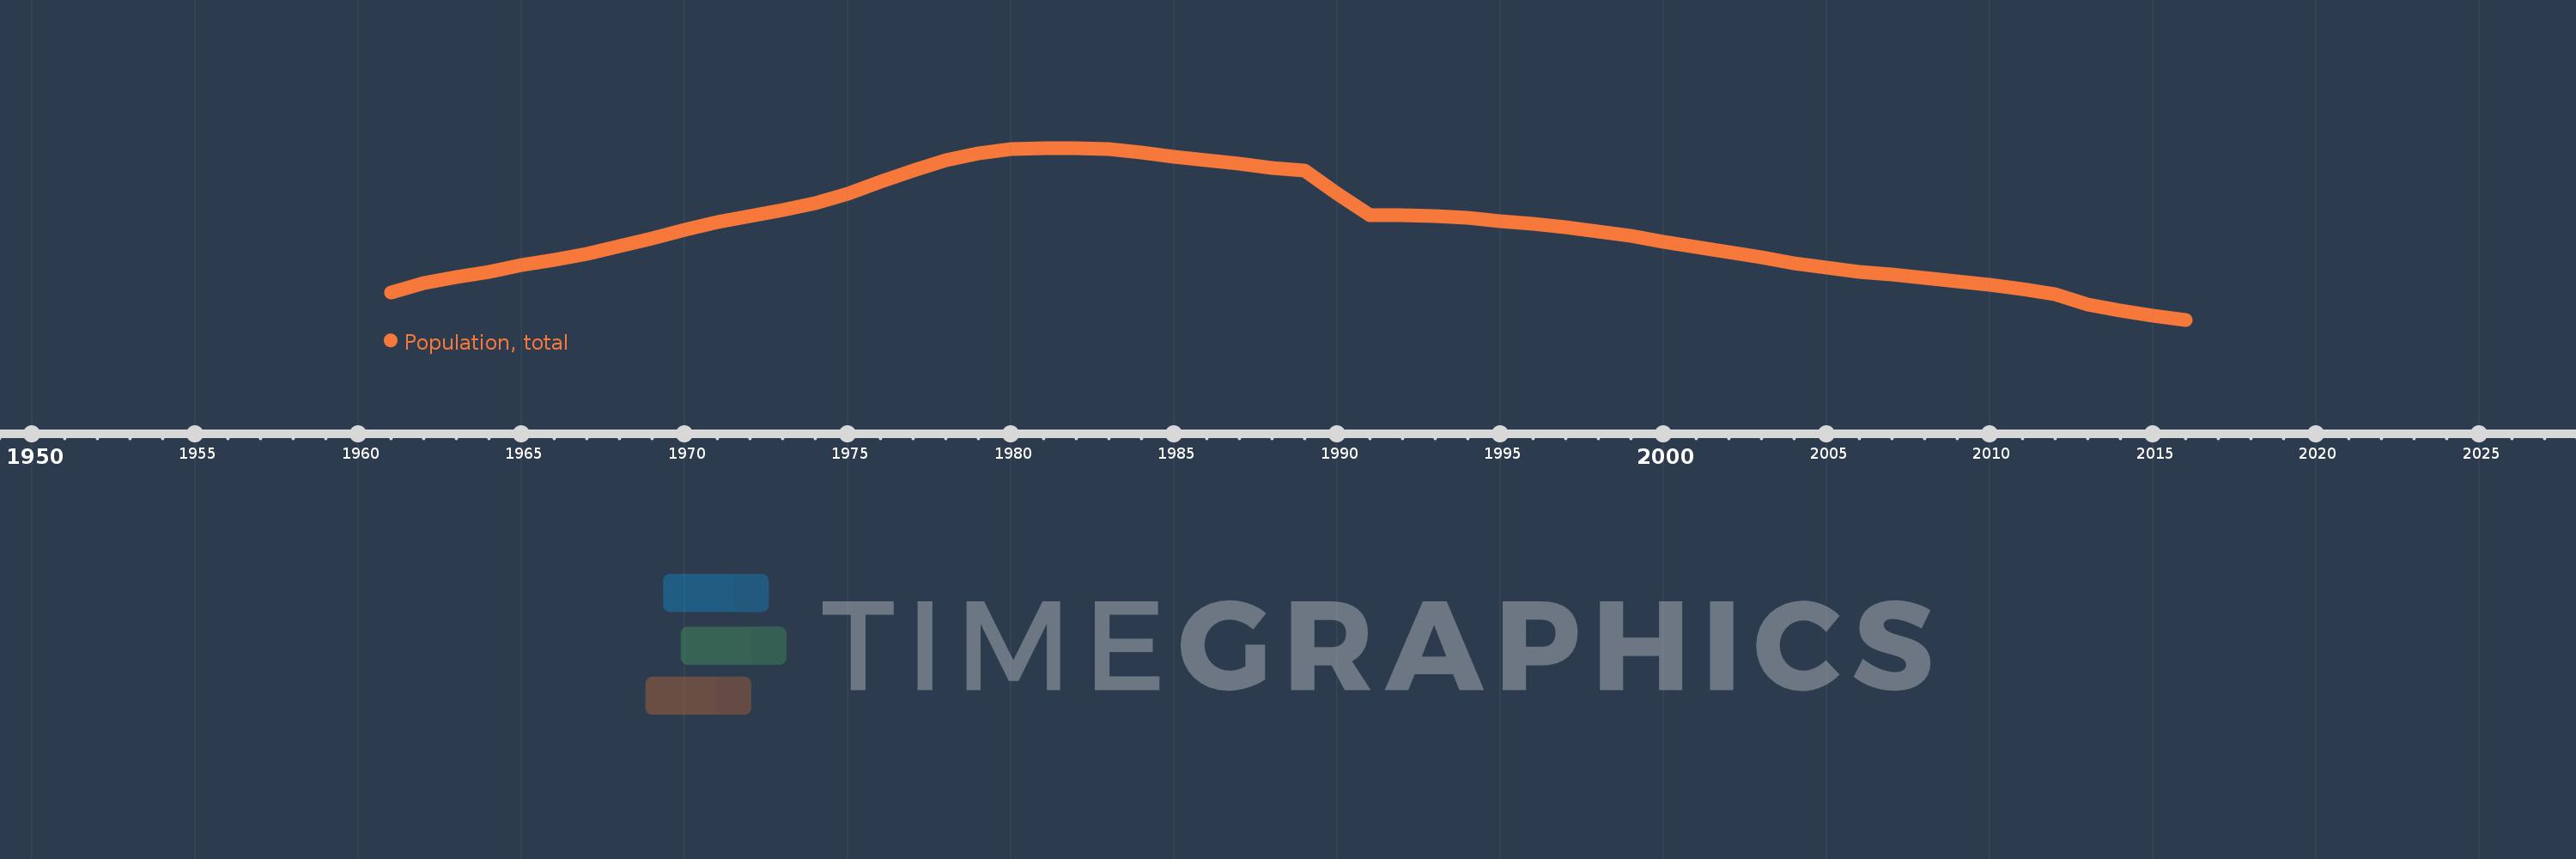
Population, total
2016,2015,2014,2013,2012,2011,2010,2009,2008,2007,2006,2005,2004,2003,2002,2001,2000,1999,1998,1997,1996,1995,1994,1993,1992,1991,1990,1989,1988,1987,1986,1985,1984,1983,1982,1981,1980,1979,1978,1977,1976,1975,1974,1973,1972,1971,1970,1969,1968,1967,1966,1965,1964,1963,1962,1961
This statistics in other country:
AfghanistanAlbaniaAlgeriaAmerican SamoaAndorraAngolaAntigua and BarbudaArab WorldArgentinaArmeniaArubaAustraliaAustriaAzerbaijanBahamas, TheBahrainBangladeshBarbadosBelarusBelgiumBelizeBeninBermudaBhutanBoliviaBosnia and HerzegovinaBotswanaBrazilBritish Virgin IslandsBrunei DarussalamBulgariaBurkina FasoBurundiCabo VerdeCambodiaCameroonCanadaCaribbean small statesCayman IslandsCentral African RepublicCentral Europe and the BalticsChadChannel IslandsChileChinaColombiaComorosCongo, Dem. Rep.Congo, Rep.Costa RicaCote d'IvoireCroatiaCubaCuracaoCyprusCzech RepublicDenmarkDjiboutiDominicaDominican RepublicEarly-demographic dividendEast Asia & PacificEast Asia & Pacific (excluding high income)East Asia & Pacific (IDA & IBRD countries)EcuadorEgypt, Arab Rep.El SalvadorEquatorial GuineaEritreaEstoniaEthiopiaEuro areaEurope & Central AsiaEurope & Central Asia (excluding high income)Europe & Central Asia (IDA & IBRD countries)European UnionFaroe IslandsFijiFinlandFragile and conflict affected situationsFranceFrench PolynesiaGabonGambia, TheGeorgiaGermanyGhanaGibraltarGreeceGreenlandGrenadaGuamGuatemalaGuineaGuinea-BissauGuyanaHaitiHeavily indebted poor countries (HIPC)High incomeHondurasHong Kong SAR, ChinaHungaryIBRD onlyIcelandIDA & IBRD totalIDA blendIDA onlyIDA totalIndiaIndonesiaIran, Islamic Rep.IraqIrelandIsle of ManIsraelItalyJamaicaJapanJordanKazakhstanKenyaKiribatiKorea, Dem. People’s Rep.Korea, Rep.KosovoKuwaitKyrgyz RepublicLao PDRLate-demographic dividendLatin America & Caribbean Latin America & Caribbean (excluding high income)Latin America & the Caribbean (IDA & IBRD countries)LatviaLeast developed countries: UN classificationLebanonLesothoLiberiaLibyaLiechtensteinLithuaniaLow & middle incomeLow incomeLower middle incomeLuxembourgMacao SAR, ChinaMacedonia, FYRMadagascarMalawiMalaysiaMaldivesMaliMaltaMarshall IslandsMauritaniaMauritiusMexicoMicronesia, Fed. Sts.Middle East & North AfricaMiddle East & North Africa (excluding high income)Middle East & North Africa (IDA & IBRD countries)Middle incomeMoldovaMonacoMongoliaMontenegroMoroccoMozambiqueMyanmarNamibiaNauruNepalNetherlandsNew CaledoniaNew ZealandNicaraguaNigerNigeriaNorth AmericaNorthern Mariana IslandsNorwayOECD membersOmanOther small statesPacific island small statesPakistanPalauPanamaPapua New GuineaParaguayPeruPhilippinesPolandPortugalPost-demographic dividendPre-demographic dividendPuerto RicoQatarRomaniaRussian FederationRwandaSamoaSan MarinoSao Tome and PrincipeSaudi ArabiaSenegalSerbiaSeychellesSierra LeoneSingaporeSint Maarten (Dutch part)Slovak RepublicSloveniaSmall statesSolomon IslandsSomaliaSouth AfricaSouth AsiaSouth Asia (IDA & IBRD)South SudanSpainSri LankaSt. Kitts and NevisSt. LuciaSt. Martin (French part)St. Vincent and the GrenadinesSub-Saharan Africa Sub-Saharan Africa (excluding high income)Sub-Saharan Africa (IDA & IBRD countries)SudanSurinameSwazilandSwedenSwitzerlandSyrian Arab RepublicTajikistanTanzaniaThailandTimor-LesteTogoTongaTrinidad and TobagoTunisiaTurkeyTurkmenistanTurks and Caicos IslandsTuvaluUgandaUkraineUnited Arab EmiratesUnited KingdomUnited StatesUpper middle incomeUruguayUzbekistanVanuatuVenezuela, RBVietnamVirgin Islands (U.S.)West Bank and GazaWorldYemen, Rep.ZambiaZimbabwe Timeline:
This timeline shows a graph from 1961 to 2016 of Hungary. No data until 1960. Number of actual observations by date: 56.
Source name:
World Development Indicators
Source organization:
(1) United Nations Population Division. World Population Prospects, (2) Census reports and other statistical publications from national statistical offices, (3) Eurostat: Demographic Statistics, (4) United Nations Statistical Division. Population and Vital Statistics Report (various years), (5) U.S. Census Bureau: International Database, and (6) Secretariat of the Pacific Community: Statistics and Demography Programme.
Categories, topics:
Climate Change, Health
Last updated:
apr 23, 2017
Indicators value changes by year
Minimum:
9.845 mln
jan 1, 2016
Maximum:
10.712 mln
jan 1, 1982
At the date of observation
Value
Absolute change
Change from previous value
jan 1, 1961
9.984 mln
+9.984 mln
0.0%
jan 1, 1962
10.029 mln
+45.354K
0.45%
jan 1, 1963
10.062 mln
+32.413K
0.32%
jan 1, 1964
10.088 mln
+26.213K
0.26%
jan 1, 1965
10.12 mln
+31.888K
0.32%
jan 1, 1966
10.148 mln
+28.1K
0.28%
jan 1, 1967
10.179 mln
+30.718K
0.3%
jan 1, 1968
10.217 mln
+37.951K
0.37%
jan 1, 1969
10.256 mln
+39.211K
0.38%
jan 1, 1970
10.299 mln
+42.908K
0.42%
jan 1, 1971
10.338 mln
+39.187K
0.38%
jan 1, 1972
10.368 mln
+29.627K
0.29%
jan 1, 1973
10.398 mln
+30.952K
0.3%
jan 1, 1974
10.432 mln
+33.566K
0.32%
jan 1, 1975
10.479 mln
+46.665K
0.45%
jan 1, 1976
10.541 mln
+61.805K
0.59%
jan 1, 1977
10.599 mln
+58.152K
0.55%
jan 1, 1978
10.648 mln
+49.354K
0.47%
jan 1, 1979
10.685 mln
+36.791K
0.35%
jan 1, 1980
10.704 mln
+19.33K
0.18%
jan 1, 1981
10.711 mln
+6.97K
0.07%
jan 1, 1982
10.712 mln
+726.0
0.01%
jan 1, 1983
10.706 mln
-6.313K
-0.06%
jan 1, 1984
10.689 mln
-16.072K
-0.15%
jan 1, 1985
10.668 mln
-21.368K
-0.2%
jan 1, 1986
10.649 mln
-19.382K
-0.18%
jan 1, 1987
10.631 mln
-18.149K
-0.17%
jan 1, 1988
10.613 mln
-17.823K
-0.17%
jan 1, 1989
10.596 mln
-16.254K
-0.15%
jan 1, 1990
10.482 mln
-114.768K
-1.08%
jan 1, 1991
10.374 mln
-107.731K
-1.03%
jan 1, 1992
10.373 mln
-588.0
-0.01%
jan 1, 1993
10.369 mln
-4.059K
-0.04%
jan 1, 1994
10.358 mln
-11.818K
-0.11%
jan 1, 1995
10.343 mln
-14.168K
-0.14%
jan 1, 1996
10.329 mln
-14.39K
-0.14%
jan 1, 1997
10.311 mln
-17.727K
-0.17%
jan 1, 1998
10.29 mln
-20.752K
-0.2%
jan 1, 1999
10.267 mln
-23.916K
-0.23%
jan 1, 2000
10.238 mln
-29.04K
-0.28%
jan 1, 2001
10.211 mln
-26.559K
-0.26%
jan 1, 2002
10.188 mln
-23.395K
-0.23%
jan 1, 2003
10.159 mln
-28.968K
-0.28%
jan 1, 2004
10.13 mln
-29.056K
-0.29%
jan 1, 2005
10.107 mln
-22.406K
-0.22%
jan 1, 2006
10.087 mln
-20.081K
-0.2%
jan 1, 2007
10.071 mln
-15.695K
-0.16%
jan 1, 2008
10.056 mln
-15.59K
-0.15%
jan 1, 2009
10.038 mln
-17.592K
-0.17%
jan 1, 2010
10.023 mln
-15.538K
-0.15%
jan 1, 2011
10.0 mln
-22.627K
-0.23%
jan 1, 2012
9.972 mln
-28.296K
-0.28%
jan 1, 2013
9.92 mln
-51.365K
-0.52%
jan 1, 2014
9.893 mln
-27.28K
-0.27%
jan 1, 2015
9.866 mln
-26.614K
-0.27%
jan 1, 2016
9.845 mln
-21.782K
-0.22%
Ranking of countries by current statistics by years


Comments: