29
/
en
AIzaSyAYiBZKx7MnpbEhh9jyipgxe19OcubqV5w
April 1, 2024
60204
Sub-Saharan Africa (excluding high income)
SSA
false
2
1
Population, total
2016,2015,2014,2013,2012,2011,2010,2009,2008,2007,2006,2005,2004,2003,2002,2001,2000,1999,1998,1997,1996,1995,1994,1993,1992,1991,1990,1989,1988,1987,1986,1985,1984,1983,1982,1981,1980,1979,1978,1977,1976,1975,1974,1973,1972,1971,1970,1969,1968,1967,1966,1965,1964,1963,1962,1961
This statistics in other country:
AfghanistanAlbaniaAlgeriaAmerican SamoaAndorraAngolaAntigua and BarbudaArab WorldArgentinaArmeniaArubaAustraliaAustriaAzerbaijanBahamas, TheBahrainBangladeshBarbadosBelarusBelgiumBelizeBeninBermudaBhutanBoliviaBosnia and HerzegovinaBotswanaBrazilBritish Virgin IslandsBrunei DarussalamBulgariaBurkina FasoBurundiCabo VerdeCambodiaCameroonCanadaCaribbean small statesCayman IslandsCentral African RepublicCentral Europe and the BalticsChadChannel IslandsChileChinaColombiaComorosCongo, Dem. Rep.Congo, Rep.Costa RicaCote d'IvoireCroatiaCubaCuracaoCyprusCzech RepublicDenmarkDjiboutiDominicaDominican RepublicEarly-demographic dividendEast Asia & PacificEast Asia & Pacific (excluding high income)East Asia & Pacific (IDA & IBRD countries)EcuadorEgypt, Arab Rep.El SalvadorEquatorial GuineaEritreaEstoniaEthiopiaEuro areaEurope & Central AsiaEurope & Central Asia (excluding high income)Europe & Central Asia (IDA & IBRD countries)European UnionFaroe IslandsFijiFinlandFragile and conflict affected situationsFranceFrench PolynesiaGabonGambia, TheGeorgiaGermanyGhanaGibraltarGreeceGreenlandGrenadaGuamGuatemalaGuineaGuinea-BissauGuyanaHaitiHeavily indebted poor countries (HIPC)High incomeHondurasHong Kong SAR, ChinaHungaryIBRD onlyIcelandIDA & IBRD totalIDA blendIDA onlyIDA totalIndiaIndonesiaIran, Islamic Rep.IraqIrelandIsle of ManIsraelItalyJamaicaJapanJordanKazakhstanKenyaKiribatiKorea, Dem. People’s Rep.Korea, Rep.KosovoKuwaitKyrgyz RepublicLao PDRLate-demographic dividendLatin America & Caribbean Latin America & Caribbean (excluding high income)Latin America & the Caribbean (IDA & IBRD countries)LatviaLeast developed countries: UN classificationLebanonLesothoLiberiaLibyaLiechtensteinLithuaniaLow & middle incomeLow incomeLower middle incomeLuxembourgMacao SAR, ChinaMacedonia, FYRMadagascarMalawiMalaysiaMaldivesMaliMaltaMarshall IslandsMauritaniaMauritiusMexicoMicronesia, Fed. Sts.Middle East & North AfricaMiddle East & North Africa (excluding high income)Middle East & North Africa (IDA & IBRD countries)Middle incomeMoldovaMonacoMongoliaMontenegroMoroccoMozambiqueMyanmarNamibiaNauruNepalNetherlandsNew CaledoniaNew ZealandNicaraguaNigerNigeriaNorth AmericaNorthern Mariana IslandsNorwayOECD membersOmanOther small statesPacific island small statesPakistanPalauPanamaPapua New GuineaParaguayPeruPhilippinesPolandPortugalPost-demographic dividendPre-demographic dividendPuerto RicoQatarRomaniaRussian FederationRwandaSamoaSan MarinoSao Tome and PrincipeSaudi ArabiaSenegalSerbiaSeychellesSierra LeoneSingaporeSint Maarten (Dutch part)Slovak RepublicSloveniaSmall statesSolomon IslandsSomaliaSouth AfricaSouth AsiaSouth Asia (IDA & IBRD)South SudanSpainSri LankaSt. Kitts and NevisSt. LuciaSt. Martin (French part)St. Vincent and the GrenadinesSub-Saharan Africa Sub-Saharan Africa (excluding high income)Sub-Saharan Africa (IDA & IBRD countries)SudanSurinameSwazilandSwedenSwitzerlandSyrian Arab RepublicTajikistanTanzaniaThailandTimor-LesteTogoTongaTrinidad and TobagoTunisiaTurkeyTurkmenistanTurks and Caicos IslandsTuvaluUgandaUkraineUnited Arab EmiratesUnited KingdomUnited StatesUpper middle incomeUruguayUzbekistanVanuatuVenezuela, RBVietnamVirgin Islands (U.S.)West Bank and GazaWorldYemen, Rep.ZambiaZimbabwe Timeline:
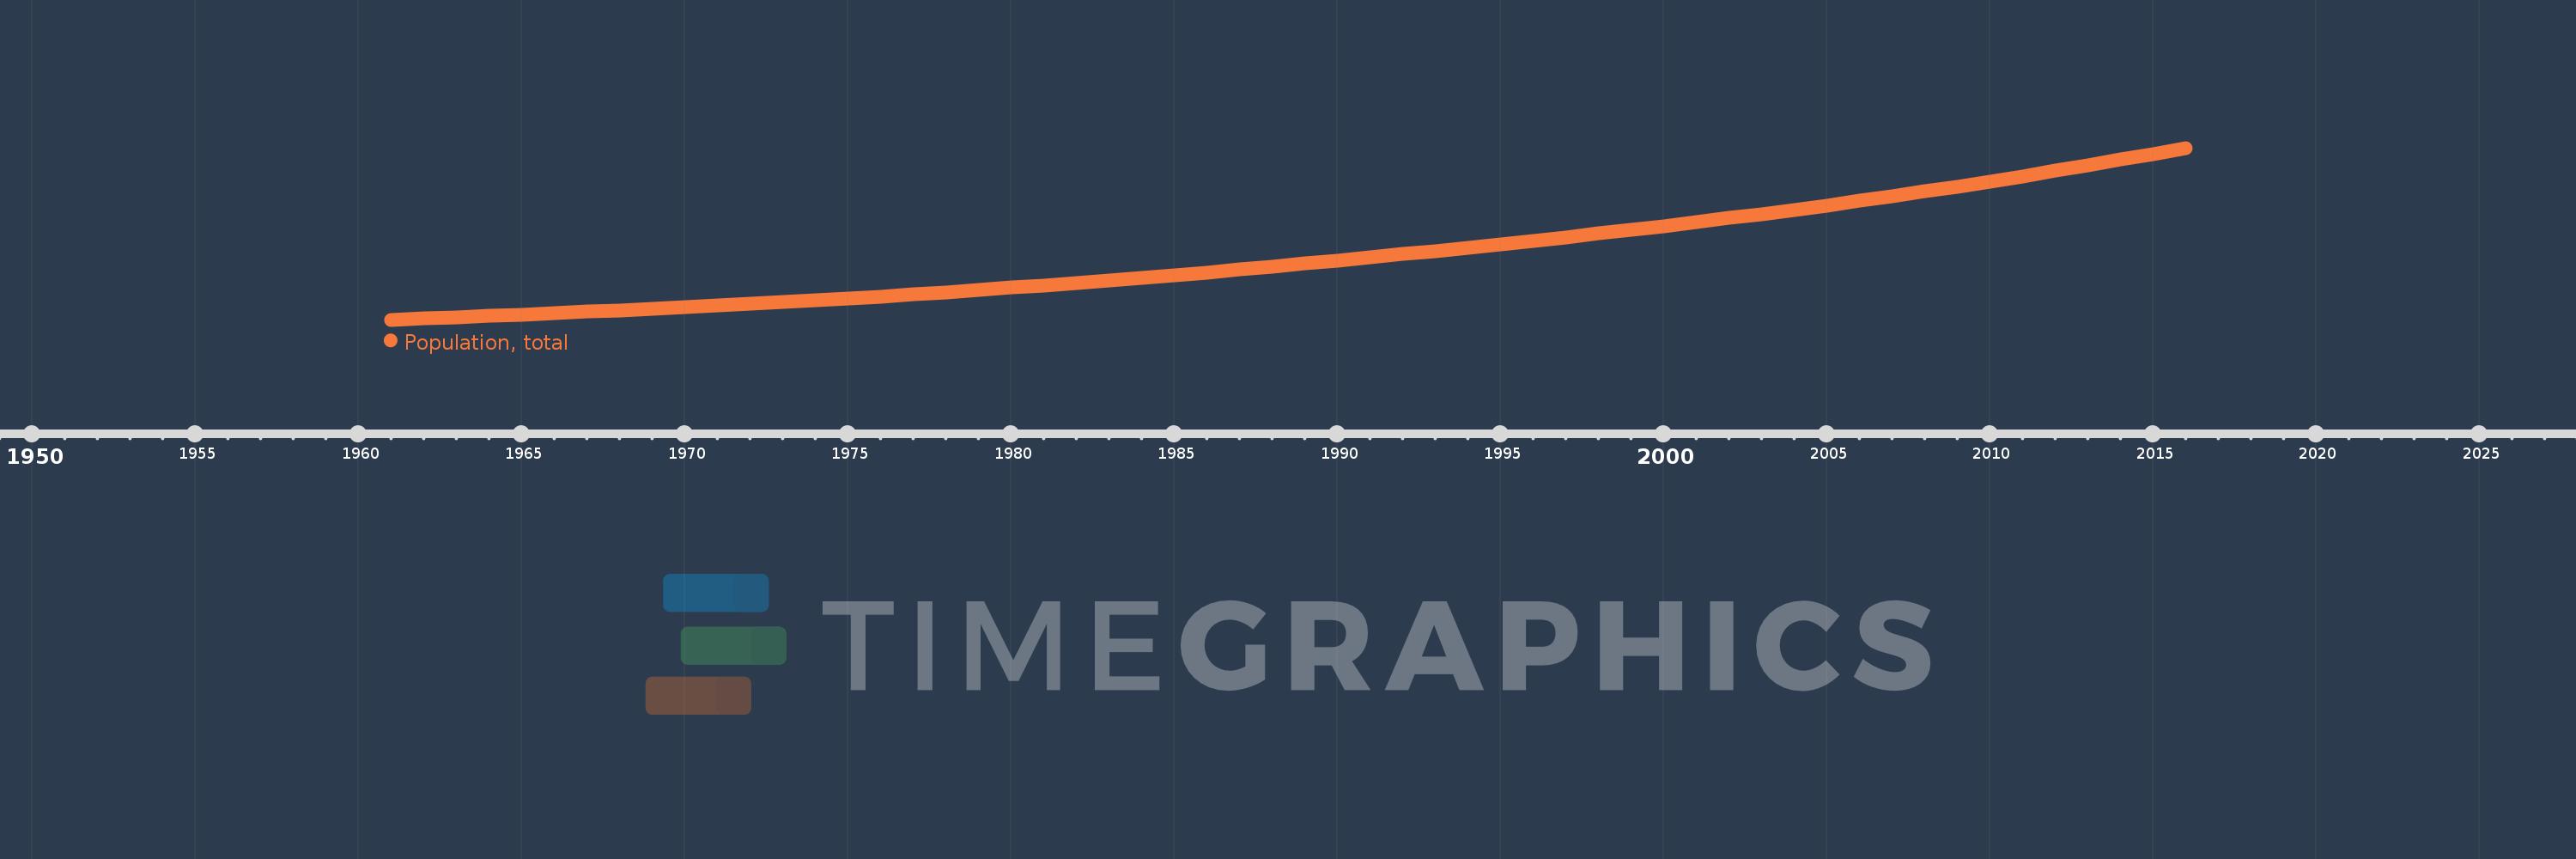
This timeline shows a graph from 1961 to 2016 of Sub-Saharan Africa (excluding high income). No data until 1960. Number of actual observations by date: 56.
Source name:
World Development Indicators
Source organization:
(1) United Nations Population Division. World Population Prospects, (2) Census reports and other statistical publications from national statistical offices, (3) Eurostat: Demographic Statistics, (4) United Nations Statistical Division. Population and Vital Statistics Report (various years), (5) U.S. Census Bureau: International Database, and (6) Secretariat of the Pacific Community: Statistics and Demography Programme.
Categories, topics:
Climate Change, Health
Last updated:
apr 23, 2017
Indicators value changes by year
Minimum:
228.227 mln
jan 1, 1961
Maximum:
1.001 bln
jan 1, 2016
At the date of observation
Value
Absolute change
Change from previous value
jan 1, 1961
228.227 mln
+228.227 mln
0.0%
jan 1, 1962
233.717 mln
+5.49 mln
2.41%
jan 1, 1963
239.36 mln
+5.642 mln
2.41%
jan 1, 1964
245.172 mln
+5.812 mln
2.43%
jan 1, 1965
251.17 mln
+5.998 mln
2.45%
jan 1, 1966
257.367 mln
+6.198 mln
2.47%
jan 1, 1967
263.782 mln
+6.415 mln
2.49%
jan 1, 1968
270.428 mln
+6.646 mln
2.52%
jan 1, 1969
277.314 mln
+6.887 mln
2.55%
jan 1, 1970
284.45 mln
+7.136 mln
2.57%
jan 1, 1971
291.844 mln
+7.394 mln
2.6%
jan 1, 1972
299.524 mln
+7.68 mln
2.63%
jan 1, 1973
307.468 mln
+7.944 mln
2.65%
jan 1, 1974
315.702 mln
+8.234 mln
2.68%
jan 1, 1975
324.258 mln
+8.557 mln
2.71%
jan 1, 1976
333.163 mln
+8.905 mln
2.75%
jan 1, 1977
342.429 mln
+9.266 mln
2.78%
jan 1, 1978
352.048 mln
+9.619 mln
2.81%
jan 1, 1979
362.014 mln
+9.966 mln
2.83%
jan 1, 1980
372.327 mln
+10.314 mln
2.85%
jan 1, 1981
382.979 mln
+10.652 mln
2.86%
jan 1, 1982
393.956 mln
+10.977 mln
2.87%
jan 1, 1983
405.263 mln
+11.307 mln
2.87%
jan 1, 1984
416.916 mln
+11.653 mln
2.88%
jan 1, 1985
428.942 mln
+12.025 mln
2.88%
jan 1, 1986
441.347 mln
+12.405 mln
2.89%
jan 1, 1987
454.129 mln
+12.783 mln
2.9%
jan 1, 1988
467.269 mln
+13.14 mln
2.89%
jan 1, 1989
480.741 mln
+13.471 mln
2.88%
jan 1, 1990
494.511 mln
+13.77 mln
2.86%
jan 1, 1991
508.546 mln
+14.035 mln
2.84%
jan 1, 1992
522.937 mln
+14.391 mln
2.83%
jan 1, 1993
537.688 mln
+14.751 mln
2.82%
jan 1, 1994
552.77 mln
+15.082 mln
2.8%
jan 1, 1995
568.154 mln
+15.384 mln
2.78%
jan 1, 1996
583.817 mln
+15.663 mln
2.76%
jan 1, 1997
599.782 mln
+15.965 mln
2.73%
jan 1, 1998
616.084 mln
+16.302 mln
2.72%
jan 1, 1999
632.778 mln
+16.694 mln
2.71%
jan 1, 2000
649.95 mln
+17.172 mln
2.71%
jan 1, 2001
667.661 mln
+17.711 mln
2.72%
jan 1, 2002
685.714 mln
+18.053 mln
2.7%
jan 1, 2003
703.92 mln
+18.206 mln
2.66%
jan 1, 2004
722.749 mln
+18.829 mln
2.67%
jan 1, 2005
742.227 mln
+19.478 mln
2.69%
jan 1, 2006
762.394 mln
+20.167 mln
2.72%
jan 1, 2007
783.273 mln
+20.879 mln
2.74%
jan 1, 2008
804.865 mln
+21.592 mln
2.76%
jan 1, 2009
827.153 mln
+22.287 mln
2.77%
jan 1, 2010
850.103 mln
+22.95 mln
2.77%
jan 1, 2011
873.69 mln
+23.587 mln
2.77%
jan 1, 2012
897.911 mln
+24.221 mln
2.77%
jan 1, 2013
922.767 mln
+24.856 mln
2.77%
jan 1, 2014
948.232 mln
+25.466 mln
2.76%
jan 1, 2015
974.28 mln
+26.048 mln
2.75%
jan 1, 2016
1.001 bln
+26.608 mln
2.73%
Ranking of countries by current statistics by years


Comments: