29
/
en
AIzaSyAYiBZKx7MnpbEhh9jyipgxe19OcubqV5w
April 1, 2024
147271
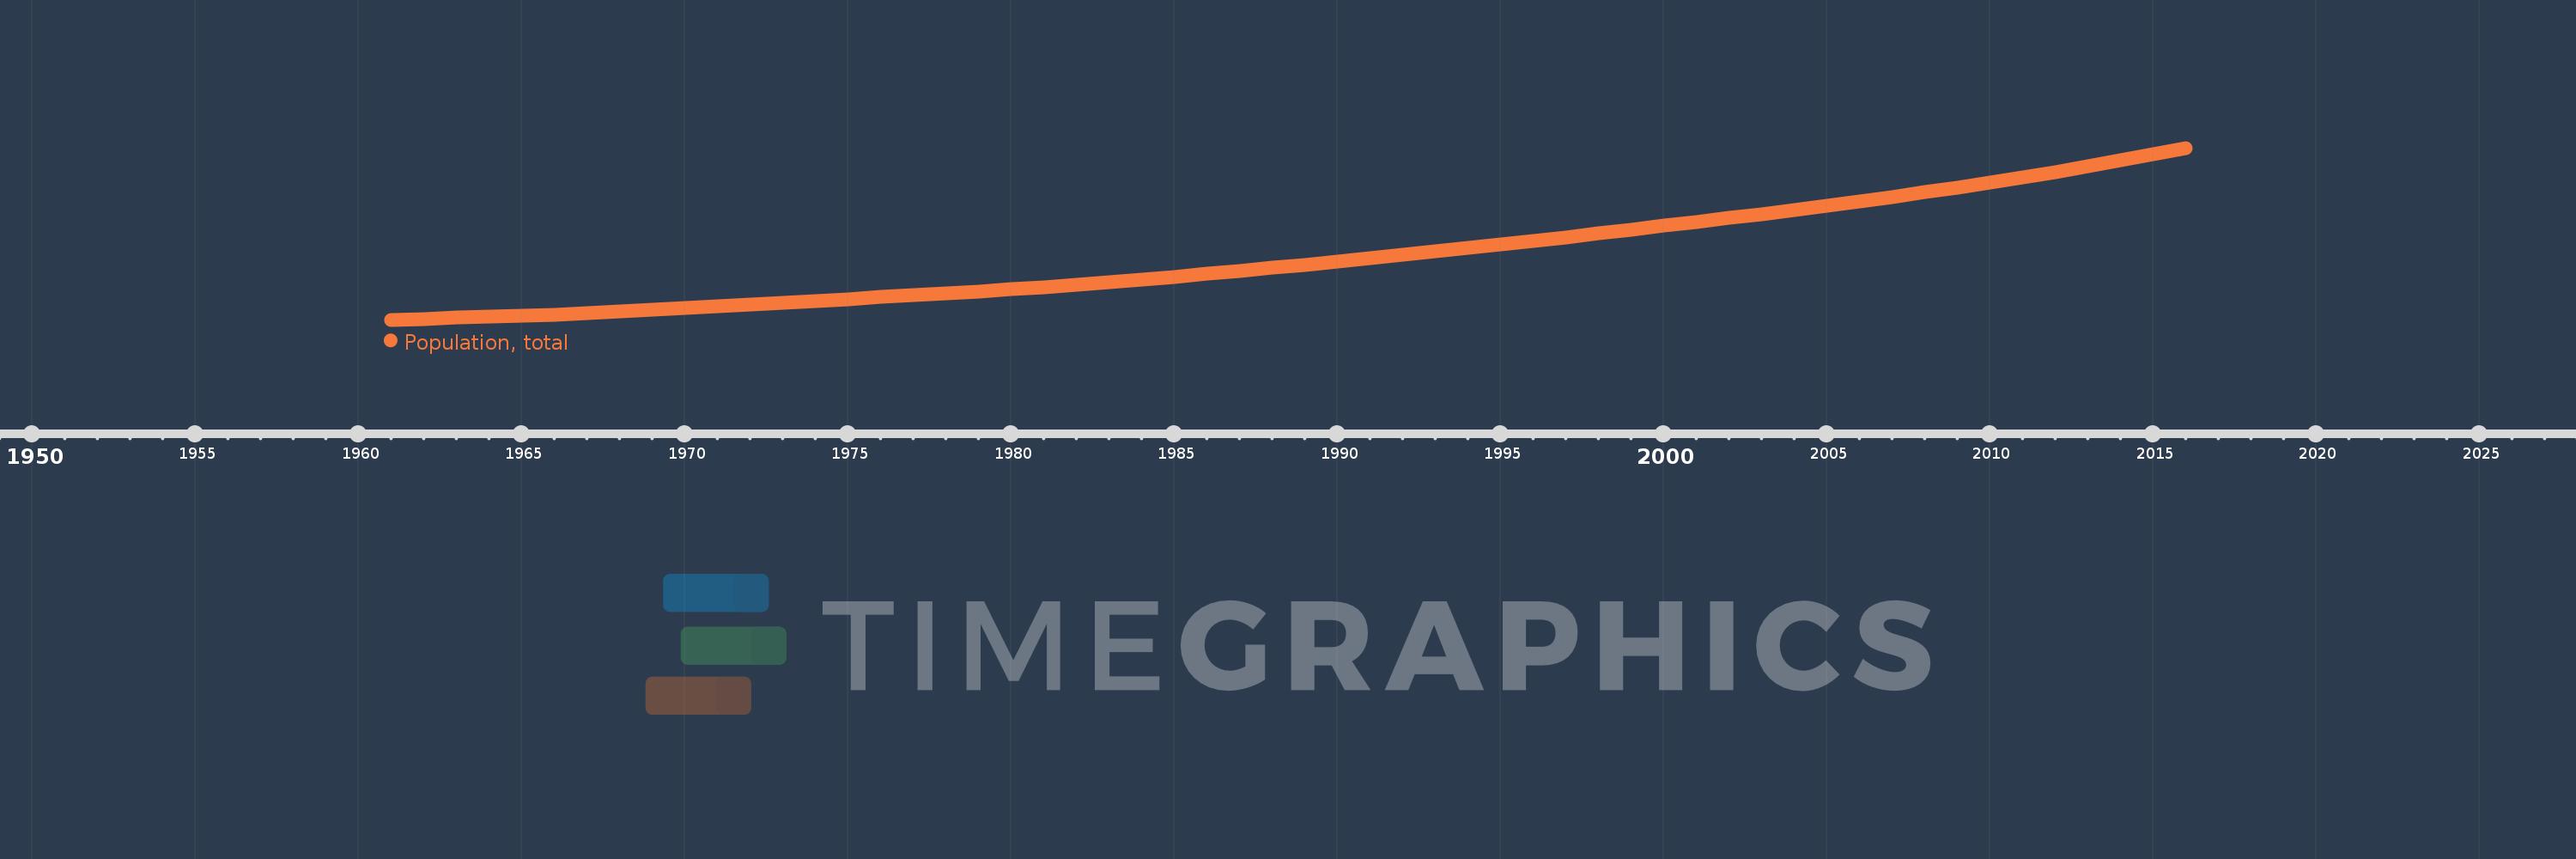
Guinea-Bissau
GNB
true
2
1
Population, total
2016,2015,2014,2013,2012,2011,2010,2009,2008,2007,2006,2005,2004,2003,2002,2001,2000,1999,1998,1997,1996,1995,1994,1993,1992,1991,1990,1989,1988,1987,1986,1985,1984,1983,1982,1981,1980,1979,1978,1977,1976,1975,1974,1973,1972,1971,1970,1969,1968,1967,1966,1965,1964,1963,1962,1961
This statistics in other country:
AfghanistanAlbaniaAlgeriaAmerican SamoaAndorraAngolaAntigua and BarbudaArab WorldArgentinaArmeniaArubaAustraliaAustriaAzerbaijanBahamas, TheBahrainBangladeshBarbadosBelarusBelgiumBelizeBeninBermudaBhutanBoliviaBosnia and HerzegovinaBotswanaBrazilBritish Virgin IslandsBrunei DarussalamBulgariaBurkina FasoBurundiCabo VerdeCambodiaCameroonCanadaCaribbean small statesCayman IslandsCentral African RepublicCentral Europe and the BalticsChadChannel IslandsChileChinaColombiaComorosCongo, Dem. Rep.Congo, Rep.Costa RicaCote d'IvoireCroatiaCubaCuracaoCyprusCzech RepublicDenmarkDjiboutiDominicaDominican RepublicEarly-demographic dividendEast Asia & PacificEast Asia & Pacific (excluding high income)East Asia & Pacific (IDA & IBRD countries)EcuadorEgypt, Arab Rep.El SalvadorEquatorial GuineaEritreaEstoniaEthiopiaEuro areaEurope & Central AsiaEurope & Central Asia (excluding high income)Europe & Central Asia (IDA & IBRD countries)European UnionFaroe IslandsFijiFinlandFragile and conflict affected situationsFranceFrench PolynesiaGabonGambia, TheGeorgiaGermanyGhanaGibraltarGreeceGreenlandGrenadaGuamGuatemalaGuineaGuinea-BissauGuyanaHaitiHeavily indebted poor countries (HIPC)High incomeHondurasHong Kong SAR, ChinaHungaryIBRD onlyIcelandIDA & IBRD totalIDA blendIDA onlyIDA totalIndiaIndonesiaIran, Islamic Rep.IraqIrelandIsle of ManIsraelItalyJamaicaJapanJordanKazakhstanKenyaKiribatiKorea, Dem. People’s Rep.Korea, Rep.KosovoKuwaitKyrgyz RepublicLao PDRLate-demographic dividendLatin America & Caribbean Latin America & Caribbean (excluding high income)Latin America & the Caribbean (IDA & IBRD countries)LatviaLeast developed countries: UN classificationLebanonLesothoLiberiaLibyaLiechtensteinLithuaniaLow & middle incomeLow incomeLower middle incomeLuxembourgMacao SAR, ChinaMacedonia, FYRMadagascarMalawiMalaysiaMaldivesMaliMaltaMarshall IslandsMauritaniaMauritiusMexicoMicronesia, Fed. Sts.Middle East & North AfricaMiddle East & North Africa (excluding high income)Middle East & North Africa (IDA & IBRD countries)Middle incomeMoldovaMonacoMongoliaMontenegroMoroccoMozambiqueMyanmarNamibiaNauruNepalNetherlandsNew CaledoniaNew ZealandNicaraguaNigerNigeriaNorth AmericaNorthern Mariana IslandsNorwayOECD membersOmanOther small statesPacific island small statesPakistanPalauPanamaPapua New GuineaParaguayPeruPhilippinesPolandPortugalPost-demographic dividendPre-demographic dividendPuerto RicoQatarRomaniaRussian FederationRwandaSamoaSan MarinoSao Tome and PrincipeSaudi ArabiaSenegalSerbiaSeychellesSierra LeoneSingaporeSint Maarten (Dutch part)Slovak RepublicSloveniaSmall statesSolomon IslandsSomaliaSouth AfricaSouth AsiaSouth Asia (IDA & IBRD)South SudanSpainSri LankaSt. Kitts and NevisSt. LuciaSt. Martin (French part)St. Vincent and the GrenadinesSub-Saharan Africa Sub-Saharan Africa (excluding high income)Sub-Saharan Africa (IDA & IBRD countries)SudanSurinameSwazilandSwedenSwitzerlandSyrian Arab RepublicTajikistanTanzaniaThailandTimor-LesteTogoTongaTrinidad and TobagoTunisiaTurkeyTurkmenistanTurks and Caicos IslandsTuvaluUgandaUkraineUnited Arab EmiratesUnited KingdomUnited StatesUpper middle incomeUruguayUzbekistanVanuatuVenezuela, RBVietnamVirgin Islands (U.S.)West Bank and GazaWorldYemen, Rep.ZambiaZimbabwe Timeline:
This timeline shows a graph from 1961 to 2016 of Guinea-Bissau. No data until 1960. Number of actual observations by date: 56.
Source name:
World Development Indicators
Source organization:
(1) United Nations Population Division. World Population Prospects, (2) Census reports and other statistical publications from national statistical offices, (3) Eurostat: Demographic Statistics, (4) United Nations Statistical Division. Population and Vital Statistics Report (various years), (5) U.S. Census Bureau: International Database, and (6) Secretariat of the Pacific Community: Statistics and Demography Programme.
Categories, topics:
Climate Change, Health
Last updated:
apr 23, 2017
Indicators value changes by year
Minimum:
616.407K
jan 1, 1961
Maximum:
1.844 mln
jan 1, 2016
At the date of observation
Value
Absolute change
Change from previous value
jan 1, 1961
616.407K
+616.407K
0.0%
jan 1, 1962
623.413K
+7.006K
1.14%
jan 1, 1963
629.973K
+6.56K
1.05%
jan 1, 1964
636.593K
+6.62K
1.05%
jan 1, 1965
643.962K
+7.369K
1.16%
jan 1, 1966
652.566K
+8.604K
1.34%
jan 1, 1967
662.597K
+10.031K
1.54%
jan 1, 1968
673.893K
+11.296K
1.7%
jan 1, 1969
686.155K
+12.262K
1.82%
jan 1, 1970
698.917K
+12.762K
1.86%
jan 1, 1971
711.828K
+12.911K
1.85%
jan 1, 1972
724.863K
+13.035K
1.83%
jan 1, 1973
738.117K
+13.254K
1.83%
jan 1, 1974
751.512K
+13.395K
1.81%
jan 1, 1975
764.974K
+13.462K
1.79%
jan 1, 1976
778.482K
+13.508K
1.77%
jan 1, 1977
791.959K
+13.477K
1.73%
jan 1, 1978
805.481K
+13.522K
1.71%
jan 1, 1979
819.371K
+13.89K
1.72%
jan 1, 1980
834.068K
+14.697K
1.79%
jan 1, 1981
849.886K
+15.818K
1.9%
jan 1, 1982
866.947K
+17.061K
2.01%
jan 1, 1983
885.166K
+18.219K
2.1%
jan 1, 1984
904.391K
+19.225K
2.17%
jan 1, 1985
924.378K
+19.987K
2.21%
jan 1, 1986
944.941K
+20.563K
2.22%
jan 1, 1987
966.039K
+21.098K
2.23%
jan 1, 1988
987.718K
+21.679K
2.24%
jan 1, 1989
1.01 mln
+22.249K
2.25%
jan 1, 1990
1.033 mln
+22.83K
2.26%
jan 1, 1991
1.056 mln
+23.411K
2.27%
jan 1, 1992
1.08 mln
+23.983K
2.27%
jan 1, 1993
1.105 mln
+24.517K
2.27%
jan 1, 1994
1.13 mln
+24.998K
2.26%
jan 1, 1995
1.155 mln
+25.405K
2.25%
jan 1, 1996
1.181 mln
+25.766K
2.23%
jan 1, 1997
1.207 mln
+26.129K
2.21%
jan 1, 1998
1.234 mln
+26.514K
2.2%
jan 1, 1999
1.26 mln
+26.904K
2.18%
jan 1, 2000
1.288 mln
+27.303K
2.17%
jan 1, 2001
1.315 mln
+27.728K
2.15%
jan 1, 2002
1.344 mln
+28.191K
2.14%
jan 1, 2003
1.372 mln
+28.721K
2.14%
jan 1, 2004
1.402 mln
+29.349K
2.14%
jan 1, 2005
1.432 mln
+30.1K
2.15%
jan 1, 2006
1.463 mln
+30.968K
2.16%
jan 1, 2007
1.495 mln
+31.819K
2.18%
jan 1, 2008
1.527 mln
+32.739K
2.19%
jan 1, 2009
1.561 mln
+33.951K
2.22%
jan 1, 2010
1.597 mln
+35.539K
2.28%
jan 1, 2011
1.634 mln
+37.364K
2.34%
jan 1, 2012
1.674 mln
+39.313K
2.41%
jan 1, 2013
1.715 mln
+41.111K
2.46%
jan 1, 2014
1.757 mln
+42.518K
2.48%
jan 1, 2015
1.801 mln
+43.375K
2.47%
jan 1, 2016
1.844 mln
+43.812K
2.43%
Ranking of countries by current statistics by years


Comments: