29
/
en
AIzaSyAYiBZKx7MnpbEhh9jyipgxe19OcubqV5w
April 1, 2024
266168
Tonga
TON
true
2
1
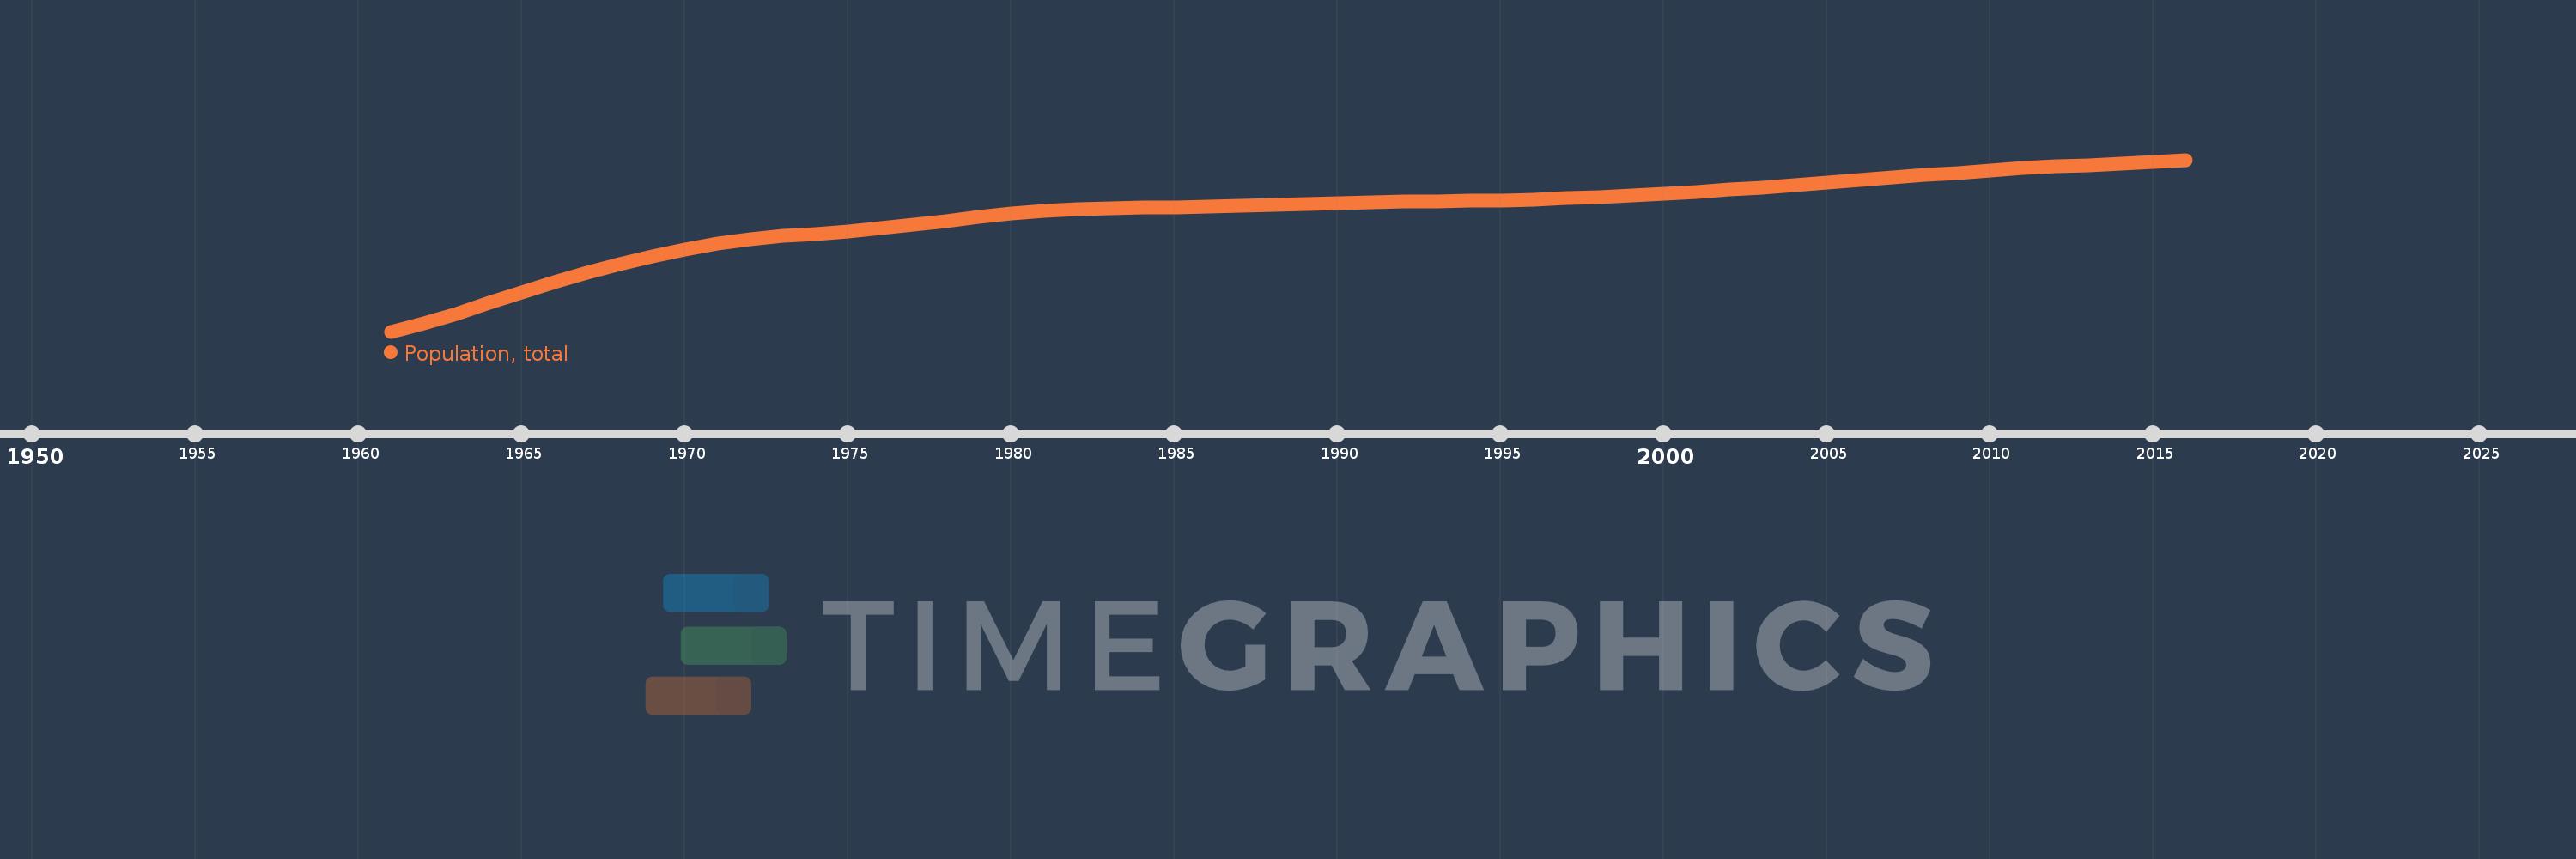
Population, total
2016,2015,2014,2013,2012,2011,2010,2009,2008,2007,2006,2005,2004,2003,2002,2001,2000,1999,1998,1997,1996,1995,1994,1993,1992,1991,1990,1989,1988,1987,1986,1985,1984,1983,1982,1981,1980,1979,1978,1977,1976,1975,1974,1973,1972,1971,1970,1969,1968,1967,1966,1965,1964,1963,1962,1961
This statistics in other country:
AfghanistanAlbaniaAlgeriaAmerican SamoaAndorraAngolaAntigua and BarbudaArab WorldArgentinaArmeniaArubaAustraliaAustriaAzerbaijanBahamas, TheBahrainBangladeshBarbadosBelarusBelgiumBelizeBeninBermudaBhutanBoliviaBosnia and HerzegovinaBotswanaBrazilBritish Virgin IslandsBrunei DarussalamBulgariaBurkina FasoBurundiCabo VerdeCambodiaCameroonCanadaCaribbean small statesCayman IslandsCentral African RepublicCentral Europe and the BalticsChadChannel IslandsChileChinaColombiaComorosCongo, Dem. Rep.Congo, Rep.Costa RicaCote d'IvoireCroatiaCubaCuracaoCyprusCzech RepublicDenmarkDjiboutiDominicaDominican RepublicEarly-demographic dividendEast Asia & PacificEast Asia & Pacific (excluding high income)East Asia & Pacific (IDA & IBRD countries)EcuadorEgypt, Arab Rep.El SalvadorEquatorial GuineaEritreaEstoniaEthiopiaEuro areaEurope & Central AsiaEurope & Central Asia (excluding high income)Europe & Central Asia (IDA & IBRD countries)European UnionFaroe IslandsFijiFinlandFragile and conflict affected situationsFranceFrench PolynesiaGabonGambia, TheGeorgiaGermanyGhanaGibraltarGreeceGreenlandGrenadaGuamGuatemalaGuineaGuinea-BissauGuyanaHaitiHeavily indebted poor countries (HIPC)High incomeHondurasHong Kong SAR, ChinaHungaryIBRD onlyIcelandIDA & IBRD totalIDA blendIDA onlyIDA totalIndiaIndonesiaIran, Islamic Rep.IraqIrelandIsle of ManIsraelItalyJamaicaJapanJordanKazakhstanKenyaKiribatiKorea, Dem. People’s Rep.Korea, Rep.KosovoKuwaitKyrgyz RepublicLao PDRLate-demographic dividendLatin America & Caribbean Latin America & Caribbean (excluding high income)Latin America & the Caribbean (IDA & IBRD countries)LatviaLeast developed countries: UN classificationLebanonLesothoLiberiaLibyaLiechtensteinLithuaniaLow & middle incomeLow incomeLower middle incomeLuxembourgMacao SAR, ChinaMacedonia, FYRMadagascarMalawiMalaysiaMaldivesMaliMaltaMarshall IslandsMauritaniaMauritiusMexicoMicronesia, Fed. Sts.Middle East & North AfricaMiddle East & North Africa (excluding high income)Middle East & North Africa (IDA & IBRD countries)Middle incomeMoldovaMonacoMongoliaMontenegroMoroccoMozambiqueMyanmarNamibiaNauruNepalNetherlandsNew CaledoniaNew ZealandNicaraguaNigerNigeriaNorth AmericaNorthern Mariana IslandsNorwayOECD membersOmanOther small statesPacific island small statesPakistanPalauPanamaPapua New GuineaParaguayPeruPhilippinesPolandPortugalPost-demographic dividendPre-demographic dividendPuerto RicoQatarRomaniaRussian FederationRwandaSamoaSan MarinoSao Tome and PrincipeSaudi ArabiaSenegalSerbiaSeychellesSierra LeoneSingaporeSint Maarten (Dutch part)Slovak RepublicSloveniaSmall statesSolomon IslandsSomaliaSouth AfricaSouth AsiaSouth Asia (IDA & IBRD)South SudanSpainSri LankaSt. Kitts and NevisSt. LuciaSt. Martin (French part)St. Vincent and the GrenadinesSub-Saharan Africa Sub-Saharan Africa (excluding high income)Sub-Saharan Africa (IDA & IBRD countries)SudanSurinameSwazilandSwedenSwitzerlandSyrian Arab RepublicTajikistanTanzaniaThailandTimor-LesteTogoTongaTrinidad and TobagoTunisiaTurkeyTurkmenistanTurks and Caicos IslandsTuvaluUgandaUkraineUnited Arab EmiratesUnited KingdomUnited StatesUpper middle incomeUruguayUzbekistanVanuatuVenezuela, RBVietnamVirgin Islands (U.S.)West Bank and GazaWorldYemen, Rep.ZambiaZimbabwe Timeline:
This timeline shows a graph from 1961 to 2016 of Tonga. No data until 1960. Number of actual observations by date: 56.
Source name:
World Development Indicators
Source organization:
(1) United Nations Population Division. World Population Prospects, (2) Census reports and other statistical publications from national statistical offices, (3) Eurostat: Demographic Statistics, (4) United Nations Statistical Division. Population and Vital Statistics Report (various years), (5) U.S. Census Bureau: International Database, and (6) Secretariat of the Pacific Community: Statistics and Demography Programme.
Categories, topics:
Climate Change, Health
Last updated:
apr 23, 2017
Indicators value changes by year
Maximum:
106.17K
jan 1, 2016
At the date of observation
Value
Absolute change
Change from previous value
jan 1, 1961
61.6K
+61.6K
0.0%
jan 1, 1962
63.74K
+2.14K
3.47%
jan 1, 1963
66.255K
+2.515K
3.95%
jan 1, 1964
69.0K
+2.745K
4.14%
jan 1, 1965
71.757K
+2.757K
4.0%
jan 1, 1966
74.363K
+2.606K
3.63%
jan 1, 1967
76.787K
+2.424K
3.26%
jan 1, 1968
79.048K
+2.261K
2.94%
jan 1, 1969
81.096K
+2.048K
2.59%
jan 1, 1970
82.879K
+1.783K
2.2%
jan 1, 1971
84.37K
+1.491K
1.8%
jan 1, 1972
85.52K
+1.15K
1.36%
jan 1, 1973
86.349K
+829.0
0.97%
jan 1, 1974
86.985K
+636.0
0.74%
jan 1, 1975
87.609K
+624.0
0.72%
jan 1, 1976
88.347K
+738.0
0.84%
jan 1, 1977
89.258K
+911.0
1.03%
jan 1, 1978
90.296K
+1.038K
1.16%
jan 1, 1979
91.36K
+1.064K
1.18%
jan 1, 1980
92.299K
+939.0
1.03%
jan 1, 1981
93.007K
+708.0
0.77%
jan 1, 1982
93.452K
+445.0
0.48%
jan 1, 1983
93.683K
+231.0
0.25%
jan 1, 1984
93.775K
+92.0
0.1%
jan 1, 1985
93.838K
+63.0
0.07%
jan 1, 1986
93.953K
+115.0
0.12%
jan 1, 1987
94.147K
+194.0
0.21%
jan 1, 1988
94.399K
+252.0
0.27%
jan 1, 1989
94.68K
+281.0
0.3%
jan 1, 1990
94.943K
+263.0
0.28%
jan 1, 1991
95.152K
+209.0
0.22%
jan 1, 1992
95.304K
+152.0
0.16%
jan 1, 1993
95.421K
+117.0
0.12%
jan 1, 1994
95.532K
+111.0
0.12%
jan 1, 1995
95.678K
+146.0
0.15%
jan 1, 1996
95.889K
+211.0
0.22%
jan 1, 1997
96.174K
+285.0
0.3%
jan 1, 1998
96.526K
+352.0
0.37%
jan 1, 1999
96.937K
+411.0
0.43%
jan 1, 2000
97.398K
+461.0
0.48%
jan 1, 2001
97.898K
+500.0
0.51%
jan 1, 2002
98.434K
+536.0
0.55%
jan 1, 2003
99.005K
+571.0
0.58%
jan 1, 2004
99.606K
+601.0
0.61%
jan 1, 2005
100.226K
+620.0
0.62%
jan 1, 2006
100.858K
+632.0
0.63%
jan 1, 2007
101.507K
+649.0
0.64%
jan 1, 2008
102.169K
+662.0
0.65%
jan 1, 2009
102.816K
+647.0
0.63%
jan 1, 2010
103.416K
+600.0
0.58%
jan 1, 2011
103.947K
+531.0
0.51%
jan 1, 2012
104.392K
+445.0
0.43%
jan 1, 2013
104.769K
+377.0
0.36%
jan 1, 2014
105.139K
+370.0
0.35%
jan 1, 2015
105.586K
+447.0
0.43%
jan 1, 2016
106.17K
+584.0
0.55%
Ranking of countries by current statistics by years


Comments: