29
/
en
AIzaSyAYiBZKx7MnpbEhh9jyipgxe19OcubqV5w
April 1, 2024
208333
Netherlands
NLD
true
2
1
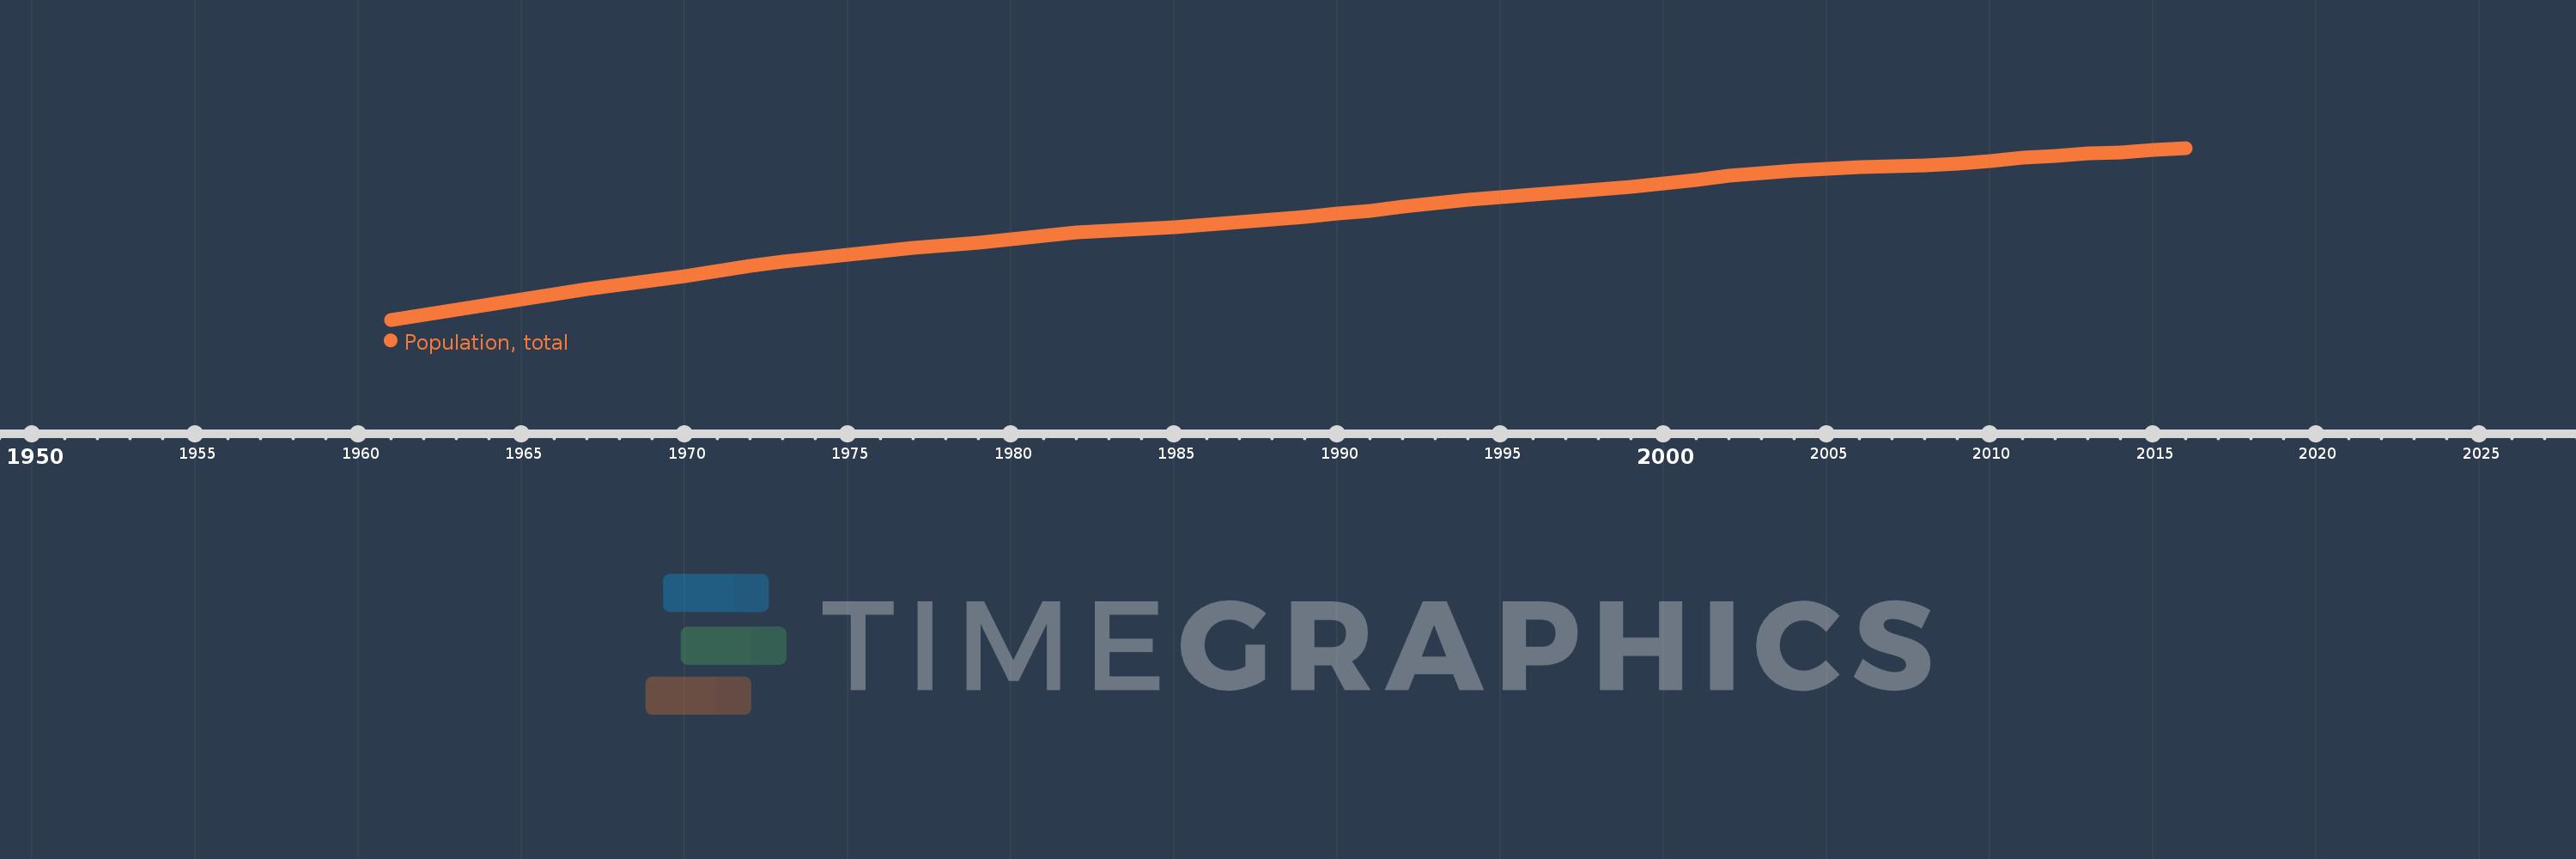
Population, total
2016,2015,2014,2013,2012,2011,2010,2009,2008,2007,2006,2005,2004,2003,2002,2001,2000,1999,1998,1997,1996,1995,1994,1993,1992,1991,1990,1989,1988,1987,1986,1985,1984,1983,1982,1981,1980,1979,1978,1977,1976,1975,1974,1973,1972,1971,1970,1969,1968,1967,1966,1965,1964,1963,1962,1961
This statistics in other country:
AfghanistanAlbaniaAlgeriaAmerican SamoaAndorraAngolaAntigua and BarbudaArab WorldArgentinaArmeniaArubaAustraliaAustriaAzerbaijanBahamas, TheBahrainBangladeshBarbadosBelarusBelgiumBelizeBeninBermudaBhutanBoliviaBosnia and HerzegovinaBotswanaBrazilBritish Virgin IslandsBrunei DarussalamBulgariaBurkina FasoBurundiCabo VerdeCambodiaCameroonCanadaCaribbean small statesCayman IslandsCentral African RepublicCentral Europe and the BalticsChadChannel IslandsChileChinaColombiaComorosCongo, Dem. Rep.Congo, Rep.Costa RicaCote d'IvoireCroatiaCubaCuracaoCyprusCzech RepublicDenmarkDjiboutiDominicaDominican RepublicEarly-demographic dividendEast Asia & PacificEast Asia & Pacific (excluding high income)East Asia & Pacific (IDA & IBRD countries)EcuadorEgypt, Arab Rep.El SalvadorEquatorial GuineaEritreaEstoniaEthiopiaEuro areaEurope & Central AsiaEurope & Central Asia (excluding high income)Europe & Central Asia (IDA & IBRD countries)European UnionFaroe IslandsFijiFinlandFragile and conflict affected situationsFranceFrench PolynesiaGabonGambia, TheGeorgiaGermanyGhanaGibraltarGreeceGreenlandGrenadaGuamGuatemalaGuineaGuinea-BissauGuyanaHaitiHeavily indebted poor countries (HIPC)High incomeHondurasHong Kong SAR, ChinaHungaryIBRD onlyIcelandIDA & IBRD totalIDA blendIDA onlyIDA totalIndiaIndonesiaIran, Islamic Rep.IraqIrelandIsle of ManIsraelItalyJamaicaJapanJordanKazakhstanKenyaKiribatiKorea, Dem. People’s Rep.Korea, Rep.KosovoKuwaitKyrgyz RepublicLao PDRLate-demographic dividendLatin America & Caribbean Latin America & Caribbean (excluding high income)Latin America & the Caribbean (IDA & IBRD countries)LatviaLeast developed countries: UN classificationLebanonLesothoLiberiaLibyaLiechtensteinLithuaniaLow & middle incomeLow incomeLower middle incomeLuxembourgMacao SAR, ChinaMacedonia, FYRMadagascarMalawiMalaysiaMaldivesMaliMaltaMarshall IslandsMauritaniaMauritiusMexicoMicronesia, Fed. Sts.Middle East & North AfricaMiddle East & North Africa (excluding high income)Middle East & North Africa (IDA & IBRD countries)Middle incomeMoldovaMonacoMongoliaMontenegroMoroccoMozambiqueMyanmarNamibiaNauruNepalNetherlandsNew CaledoniaNew ZealandNicaraguaNigerNigeriaNorth AmericaNorthern Mariana IslandsNorwayOECD membersOmanOther small statesPacific island small statesPakistanPalauPanamaPapua New GuineaParaguayPeruPhilippinesPolandPortugalPost-demographic dividendPre-demographic dividendPuerto RicoQatarRomaniaRussian FederationRwandaSamoaSan MarinoSao Tome and PrincipeSaudi ArabiaSenegalSerbiaSeychellesSierra LeoneSingaporeSint Maarten (Dutch part)Slovak RepublicSloveniaSmall statesSolomon IslandsSomaliaSouth AfricaSouth AsiaSouth Asia (IDA & IBRD)South SudanSpainSri LankaSt. Kitts and NevisSt. LuciaSt. Martin (French part)St. Vincent and the GrenadinesSub-Saharan Africa Sub-Saharan Africa (excluding high income)Sub-Saharan Africa (IDA & IBRD countries)SudanSurinameSwazilandSwedenSwitzerlandSyrian Arab RepublicTajikistanTanzaniaThailandTimor-LesteTogoTongaTrinidad and TobagoTunisiaTurkeyTurkmenistanTurks and Caicos IslandsTuvaluUgandaUkraineUnited Arab EmiratesUnited KingdomUnited StatesUpper middle incomeUruguayUzbekistanVanuatuVenezuela, RBVietnamVirgin Islands (U.S.)West Bank and GazaWorldYemen, Rep.ZambiaZimbabwe Timeline:
This timeline shows a graph from 1961 to 2016 of Netherlands. No data until 1960. Number of actual observations by date: 56.
Source name:
World Development Indicators
Source organization:
(1) United Nations Population Division. World Population Prospects, (2) Census reports and other statistical publications from national statistical offices, (3) Eurostat: Demographic Statistics, (4) United Nations Statistical Division. Population and Vital Statistics Report (various years), (5) U.S. Census Bureau: International Database, and (6) Secretariat of the Pacific Community: Statistics and Demography Programme.
Categories, topics:
Climate Change, Health
Last updated:
apr 23, 2017
Indicators value changes by year
Minimum:
11.487 mln
jan 1, 1961
Maximum:
16.937 mln
jan 1, 2016
At the date of observation
Value
Absolute change
Change from previous value
jan 1, 1961
11.487 mln
+11.487 mln
0.0%
jan 1, 1962
11.639 mln
+152.081K
1.32%
jan 1, 1963
11.806 mln
+166.977K
1.43%
jan 1, 1964
11.966 mln
+160.277K
1.36%
jan 1, 1965
12.127 mln
+161.154K
1.35%
jan 1, 1966
12.295 mln
+167.612K
1.38%
jan 1, 1967
12.456 mln
+161.519K
1.31%
jan 1, 1968
12.598 mln
+141.95K
1.14%
jan 1, 1969
12.73 mln
+131.52K
1.04%
jan 1, 1970
12.878 mln
+148.263K
1.16%
jan 1, 1971
13.039 mln
+160.542K
1.25%
jan 1, 1972
13.194 mln
+155.971K
1.2%
jan 1, 1973
13.329 mln
+134.096K
1.02%
jan 1, 1974
13.439 mln
+110.729K
0.83%
jan 1, 1975
13.545 mln
+105.734K
0.79%
jan 1, 1976
13.666 mln
+121.279K
0.9%
jan 1, 1977
13.774 mln
+107.702K
0.79%
jan 1, 1978
13.856 mln
+82.148K
0.6%
jan 1, 1979
13.942 mln
+85.515K
0.62%
jan 1, 1980
14.038 mln
+96.57K
0.69%
jan 1, 1981
14.15 mln
+111.53K
0.79%
jan 1, 1982
14.247 mln
+97.408K
0.69%
jan 1, 1983
14.313 mln
+65.482K
0.46%
jan 1, 1984
14.367 mln
+54.38K
0.38%
jan 1, 1985
14.424 mln
+57.141K
0.4%
jan 1, 1986
14.492 mln
+67.421K
0.47%
jan 1, 1987
14.572 mln
+80.646K
0.56%
jan 1, 1988
14.665 mln
+92.759K
0.64%
jan 1, 1989
14.76 mln
+95.057K
0.65%
jan 1, 1990
14.849 mln
+88.813K
0.6%
jan 1, 1991
14.952 mln
+102.603K
0.69%
jan 1, 1992
15.07 mln
+118.288K
0.79%
jan 1, 1993
15.184 mln
+114.368K
0.76%
jan 1, 1994
15.29 mln
+106.202K
0.7%
jan 1, 1995
15.383 mln
+92.47K
0.6%
jan 1, 1996
15.459 mln
+76.168K
0.5%
jan 1, 1997
15.53 mln
+71.492K
0.46%
jan 1, 1998
15.611 mln
+80.152K
0.52%
jan 1, 1999
15.707 mln
+96.559K
0.62%
jan 1, 2000
15.812 mln
+104.879K
0.67%
jan 1, 2001
15.926 mln
+113.425K
0.72%
jan 1, 2002
16.046 mln
+120.667K
0.76%
jan 1, 2003
16.149 mln
+102.749K
0.64%
jan 1, 2004
16.225 mln
+76.373K
0.47%
jan 1, 2005
16.282 mln
+56.477K
0.35%
jan 1, 2006
16.32 mln
+38.089K
0.23%
jan 1, 2007
16.346 mln
+26.233K
0.16%
jan 1, 2008
16.382 mln
+35.595K
0.22%
jan 1, 2009
16.446 mln
+63.897K
0.39%
jan 1, 2010
16.53 mln
+84.795K
0.52%
jan 1, 2011
16.615 mln
+85.006K
0.51%
jan 1, 2012
16.693 mln
+77.68K
0.47%
jan 1, 2013
16.755 mln
+61.888K
0.37%
jan 1, 2014
16.804 mln
+49.47K
0.3%
jan 1, 2015
16.865 mln
+60.576K
0.36%
jan 1, 2016
16.937 mln
+71.512K
0.42%
Ranking of countries by current statistics by years


Comments: