29
/
en
AIzaSyAYiBZKx7MnpbEhh9jyipgxe19OcubqV5w
April 1, 2024
37704
IDA & IBRD total
IBT
false
2
1
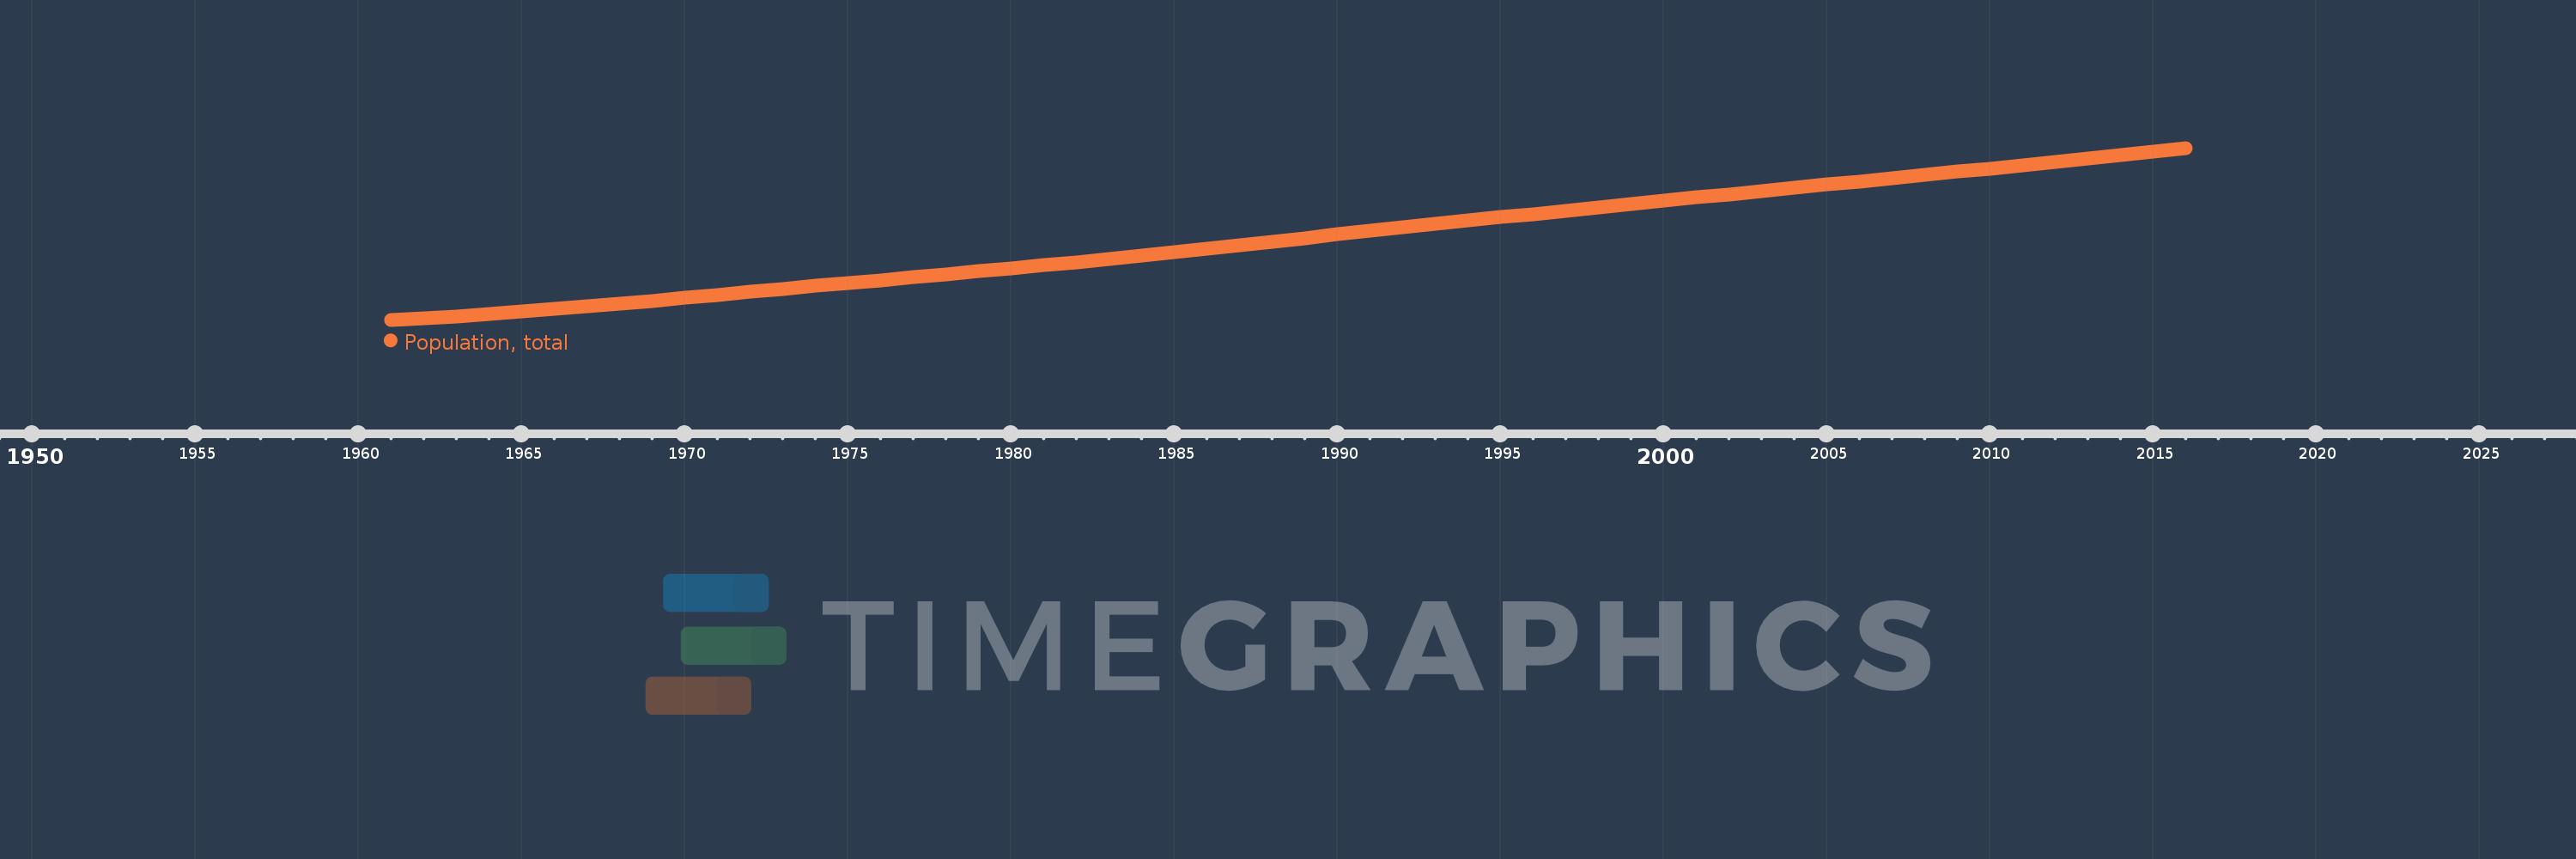
Population, total
2016,2015,2014,2013,2012,2011,2010,2009,2008,2007,2006,2005,2004,2003,2002,2001,2000,1999,1998,1997,1996,1995,1994,1993,1992,1991,1990,1989,1988,1987,1986,1985,1984,1983,1982,1981,1980,1979,1978,1977,1976,1975,1974,1973,1972,1971,1970,1969,1968,1967,1966,1965,1964,1963,1962,1961
This statistics in other country:
AfghanistanAlbaniaAlgeriaAmerican SamoaAndorraAngolaAntigua and BarbudaArab WorldArgentinaArmeniaArubaAustraliaAustriaAzerbaijanBahamas, TheBahrainBangladeshBarbadosBelarusBelgiumBelizeBeninBermudaBhutanBoliviaBosnia and HerzegovinaBotswanaBrazilBritish Virgin IslandsBrunei DarussalamBulgariaBurkina FasoBurundiCabo VerdeCambodiaCameroonCanadaCaribbean small statesCayman IslandsCentral African RepublicCentral Europe and the BalticsChadChannel IslandsChileChinaColombiaComorosCongo, Dem. Rep.Congo, Rep.Costa RicaCote d'IvoireCroatiaCubaCuracaoCyprusCzech RepublicDenmarkDjiboutiDominicaDominican RepublicEarly-demographic dividendEast Asia & PacificEast Asia & Pacific (excluding high income)East Asia & Pacific (IDA & IBRD countries)EcuadorEgypt, Arab Rep.El SalvadorEquatorial GuineaEritreaEstoniaEthiopiaEuro areaEurope & Central AsiaEurope & Central Asia (excluding high income)Europe & Central Asia (IDA & IBRD countries)European UnionFaroe IslandsFijiFinlandFragile and conflict affected situationsFranceFrench PolynesiaGabonGambia, TheGeorgiaGermanyGhanaGibraltarGreeceGreenlandGrenadaGuamGuatemalaGuineaGuinea-BissauGuyanaHaitiHeavily indebted poor countries (HIPC)High incomeHondurasHong Kong SAR, ChinaHungaryIBRD onlyIcelandIDA & IBRD totalIDA blendIDA onlyIDA totalIndiaIndonesiaIran, Islamic Rep.IraqIrelandIsle of ManIsraelItalyJamaicaJapanJordanKazakhstanKenyaKiribatiKorea, Dem. People’s Rep.Korea, Rep.KosovoKuwaitKyrgyz RepublicLao PDRLate-demographic dividendLatin America & Caribbean Latin America & Caribbean (excluding high income)Latin America & the Caribbean (IDA & IBRD countries)LatviaLeast developed countries: UN classificationLebanonLesothoLiberiaLibyaLiechtensteinLithuaniaLow & middle incomeLow incomeLower middle incomeLuxembourgMacao SAR, ChinaMacedonia, FYRMadagascarMalawiMalaysiaMaldivesMaliMaltaMarshall IslandsMauritaniaMauritiusMexicoMicronesia, Fed. Sts.Middle East & North AfricaMiddle East & North Africa (excluding high income)Middle East & North Africa (IDA & IBRD countries)Middle incomeMoldovaMonacoMongoliaMontenegroMoroccoMozambiqueMyanmarNamibiaNauruNepalNetherlandsNew CaledoniaNew ZealandNicaraguaNigerNigeriaNorth AmericaNorthern Mariana IslandsNorwayOECD membersOmanOther small statesPacific island small statesPakistanPalauPanamaPapua New GuineaParaguayPeruPhilippinesPolandPortugalPost-demographic dividendPre-demographic dividendPuerto RicoQatarRomaniaRussian FederationRwandaSamoaSan MarinoSao Tome and PrincipeSaudi ArabiaSenegalSerbiaSeychellesSierra LeoneSingaporeSint Maarten (Dutch part)Slovak RepublicSloveniaSmall statesSolomon IslandsSomaliaSouth AfricaSouth AsiaSouth Asia (IDA & IBRD)South SudanSpainSri LankaSt. Kitts and NevisSt. LuciaSt. Martin (French part)St. Vincent and the GrenadinesSub-Saharan Africa Sub-Saharan Africa (excluding high income)Sub-Saharan Africa (IDA & IBRD countries)SudanSurinameSwazilandSwedenSwitzerlandSyrian Arab RepublicTajikistanTanzaniaThailandTimor-LesteTogoTongaTrinidad and TobagoTunisiaTurkeyTurkmenistanTurks and Caicos IslandsTuvaluUgandaUkraineUnited Arab EmiratesUnited KingdomUnited StatesUpper middle incomeUruguayUzbekistanVanuatuVenezuela, RBVietnamVirgin Islands (U.S.)West Bank and GazaWorldYemen, Rep.ZambiaZimbabwe Timeline:
This timeline shows a graph from 1961 to 2016 of IDA & IBRD total. No data until 1960. Number of actual observations by date: 56.
Source name:
World Development Indicators
Source organization:
(1) United Nations Population Division. World Population Prospects, (2) Census reports and other statistical publications from national statistical offices, (3) Eurostat: Demographic Statistics, (4) United Nations Statistical Division. Population and Vital Statistics Report (various years), (5) U.S. Census Bureau: International Database, and (6) Secretariat of the Pacific Community: Statistics and Demography Programme.
Categories, topics:
Climate Change, Health
Last updated:
apr 23, 2017
Indicators value changes by year
Minimum:
2.303 bln
jan 1, 1961
Maximum:
6.184 bln
jan 1, 2016
At the date of observation
Value
Absolute change
Change from previous value
jan 1, 1961
2.303 bln
+2.303 bln
0.0%
jan 1, 1962
2.333 bln
+29.879 mln
1.3%
jan 1, 1963
2.376 bln
+43.147 mln
1.85%
jan 1, 1964
2.431 bln
+55.236 mln
2.32%
jan 1, 1965
2.487 bln
+55.868 mln
2.3%
jan 1, 1966
2.544 bln
+57.389 mln
2.31%
jan 1, 1967
2.605 bln
+61.019 mln
2.4%
jan 1, 1968
2.666 bln
+61.064 mln
2.34%
jan 1, 1969
2.729 bln
+62.804 mln
2.36%
jan 1, 1970
2.794 bln
+65.213 mln
2.39%
jan 1, 1971
2.861 bln
+66.732 mln
2.39%
jan 1, 1972
2.929 bln
+68.339 mln
2.39%
jan 1, 1973
2.997 bln
+67.811 mln
2.31%
jan 1, 1974
3.065 bln
+67.783 mln
2.26%
jan 1, 1975
3.132 bln
+67.393 mln
2.2%
jan 1, 1976
3.199 bln
+66.225 mln
2.11%
jan 1, 1977
3.264 bln
+65.761 mln
2.06%
jan 1, 1978
3.33 bln
+65.286 mln
2.0%
jan 1, 1979
3.396 bln
+66.397 mln
1.99%
jan 1, 1980
3.464 bln
+67.899 mln
2.0%
jan 1, 1981
3.533 bln
+68.855 mln
1.99%
jan 1, 1982
3.603 bln
+70.501 mln
2.0%
jan 1, 1983
3.677 bln
+73.883 mln
2.05%
jan 1, 1984
3.752 bln
+75.006 mln
2.04%
jan 1, 1985
3.827 bln
+75.102 mln
2.0%
jan 1, 1986
3.904 bln
+76.815 mln
2.01%
jan 1, 1987
3.983 bln
+79.249 mln
2.03%
jan 1, 1988
4.065 bln
+81.454 mln
2.04%
jan 1, 1989
4.147 bln
+82.134 mln
2.02%
jan 1, 1990
4.229 bln
+81.627 mln
1.97%
jan 1, 1991
4.309 bln
+80.202 mln
1.9%
jan 1, 1992
4.387 bln
+78.535 mln
1.82%
jan 1, 1993
4.464 bln
+77.124 mln
1.76%
jan 1, 1994
4.541 bln
+76.335 mln
1.71%
jan 1, 1995
4.617 bln
+75.903 mln
1.67%
jan 1, 1996
4.692 bln
+75.654 mln
1.64%
jan 1, 1997
4.768 bln
+75.412 mln
1.61%
jan 1, 1998
4.844 bln
+75.831 mln
1.59%
jan 1, 1999
4.919 bln
+75.229 mln
1.55%
jan 1, 2000
4.993 bln
+74.311 mln
1.51%
jan 1, 2001
5.066 bln
+73.119 mln
1.46%
jan 1, 2002
5.139 bln
+72.601 mln
1.43%
jan 1, 2003
5.211 bln
+71.664 mln
1.39%
jan 1, 2004
5.282 bln
+71.865 mln
1.38%
jan 1, 2005
5.354 bln
+72.051 mln
1.36%
jan 1, 2006
5.427 bln
+72.354 mln
1.35%
jan 1, 2007
5.499 bln
+72.37 mln
1.33%
jan 1, 2008
5.571 bln
+72.251 mln
1.31%
jan 1, 2009
5.645 bln
+73.1 mln
1.31%
jan 1, 2010
5.719 bln
+74.309 mln
1.32%
jan 1, 2011
5.794 bln
+75.097 mln
1.31%
jan 1, 2012
5.87 bln
+76.2 mln
1.32%
jan 1, 2013
5.947 bln
+77.219 mln
1.32%
jan 1, 2014
6.026 bln
+78.186 mln
1.31%
jan 1, 2015
6.104 bln
+78.907 mln
1.31%
jan 1, 2016
6.184 bln
+79.174 mln
1.3%
Ranking of countries by current statistics by years


Comments: