29
/
en
AIzaSyAYiBZKx7MnpbEhh9jyipgxe19OcubqV5w
April 1, 2024
135979
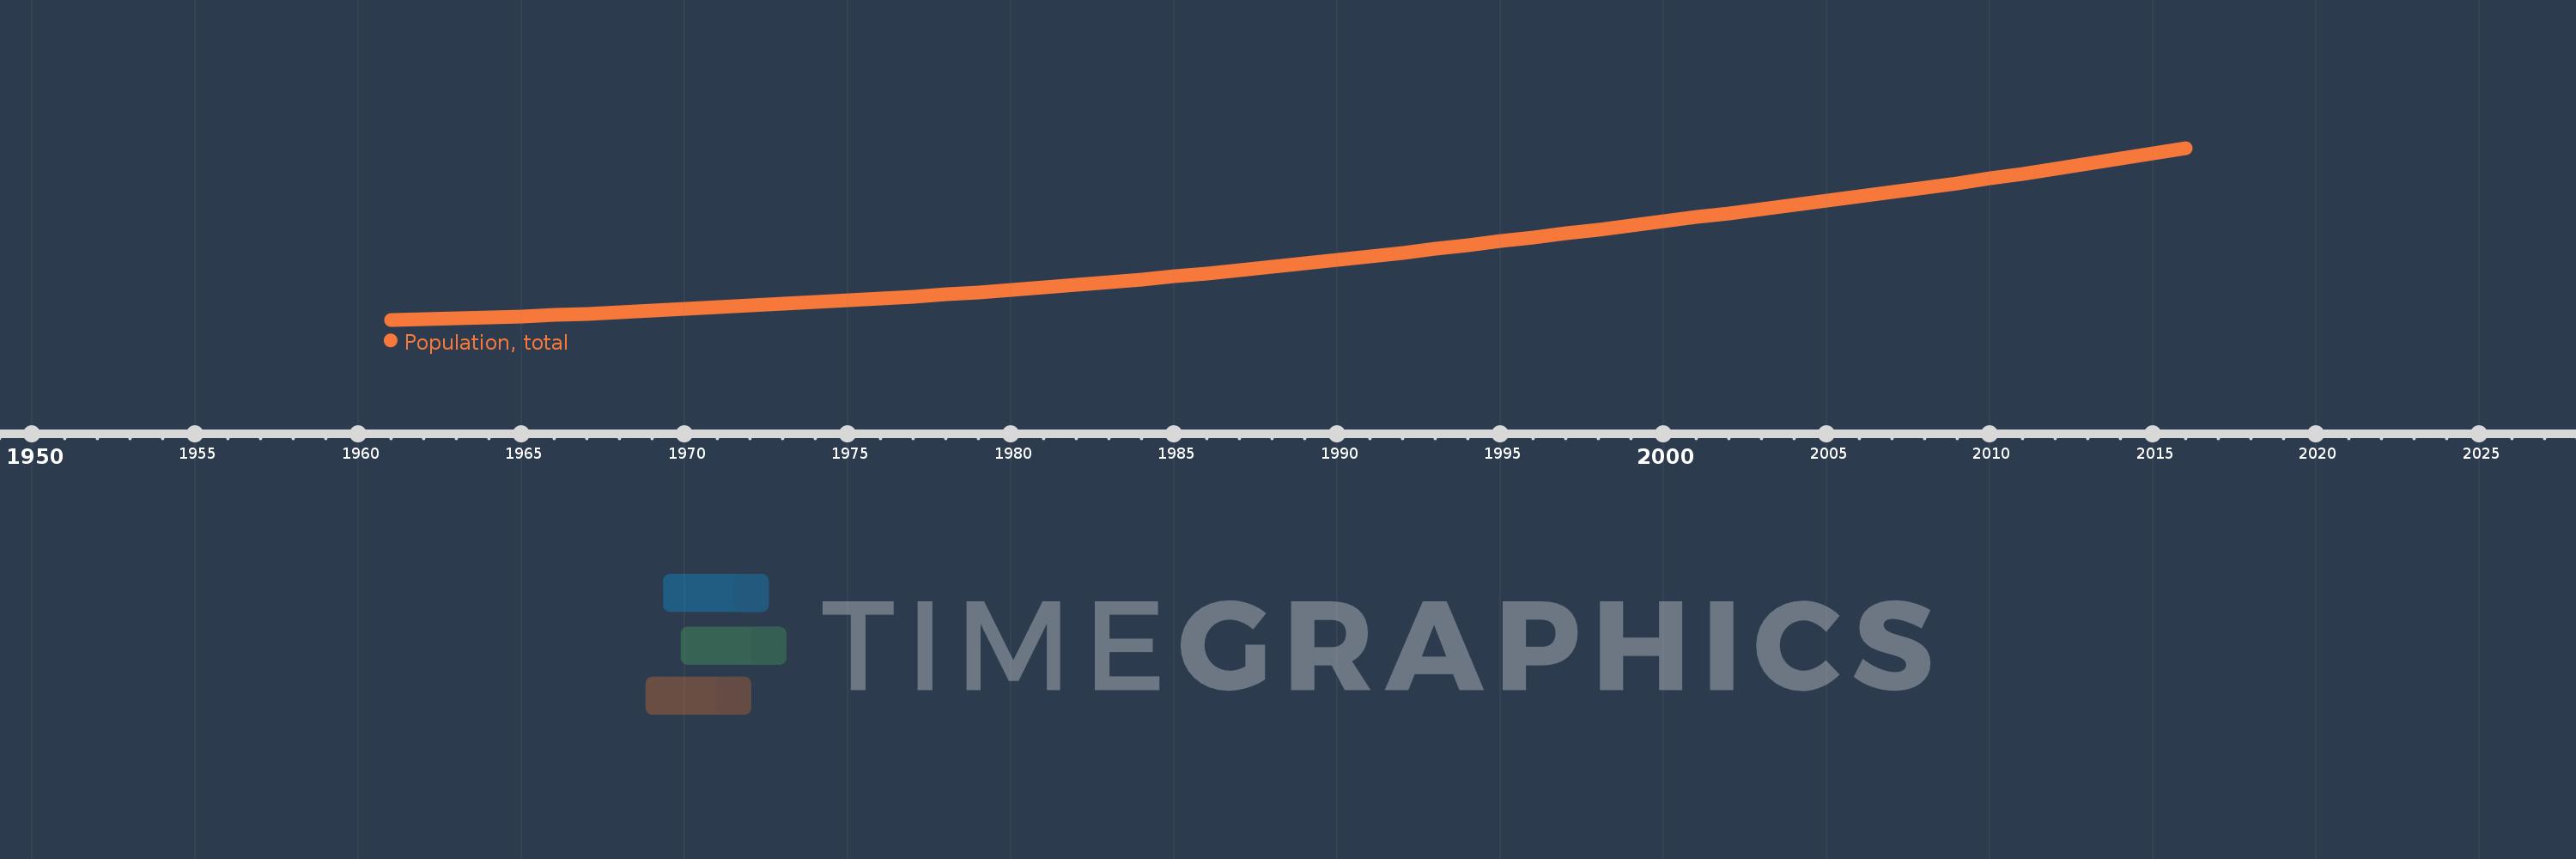
Gabon
GAB
true
2
1
Population, total
2016,2015,2014,2013,2012,2011,2010,2009,2008,2007,2006,2005,2004,2003,2002,2001,2000,1999,1998,1997,1996,1995,1994,1993,1992,1991,1990,1989,1988,1987,1986,1985,1984,1983,1982,1981,1980,1979,1978,1977,1976,1975,1974,1973,1972,1971,1970,1969,1968,1967,1966,1965,1964,1963,1962,1961
This statistics in other country:
AfghanistanAlbaniaAlgeriaAmerican SamoaAndorraAngolaAntigua and BarbudaArab WorldArgentinaArmeniaArubaAustraliaAustriaAzerbaijanBahamas, TheBahrainBangladeshBarbadosBelarusBelgiumBelizeBeninBermudaBhutanBoliviaBosnia and HerzegovinaBotswanaBrazilBritish Virgin IslandsBrunei DarussalamBulgariaBurkina FasoBurundiCabo VerdeCambodiaCameroonCanadaCaribbean small statesCayman IslandsCentral African RepublicCentral Europe and the BalticsChadChannel IslandsChileChinaColombiaComorosCongo, Dem. Rep.Congo, Rep.Costa RicaCote d'IvoireCroatiaCubaCuracaoCyprusCzech RepublicDenmarkDjiboutiDominicaDominican RepublicEarly-demographic dividendEast Asia & PacificEast Asia & Pacific (excluding high income)East Asia & Pacific (IDA & IBRD countries)EcuadorEgypt, Arab Rep.El SalvadorEquatorial GuineaEritreaEstoniaEthiopiaEuro areaEurope & Central AsiaEurope & Central Asia (excluding high income)Europe & Central Asia (IDA & IBRD countries)European UnionFaroe IslandsFijiFinlandFragile and conflict affected situationsFranceFrench PolynesiaGabonGambia, TheGeorgiaGermanyGhanaGibraltarGreeceGreenlandGrenadaGuamGuatemalaGuineaGuinea-BissauGuyanaHaitiHeavily indebted poor countries (HIPC)High incomeHondurasHong Kong SAR, ChinaHungaryIBRD onlyIcelandIDA & IBRD totalIDA blendIDA onlyIDA totalIndiaIndonesiaIran, Islamic Rep.IraqIrelandIsle of ManIsraelItalyJamaicaJapanJordanKazakhstanKenyaKiribatiKorea, Dem. People’s Rep.Korea, Rep.KosovoKuwaitKyrgyz RepublicLao PDRLate-demographic dividendLatin America & Caribbean Latin America & Caribbean (excluding high income)Latin America & the Caribbean (IDA & IBRD countries)LatviaLeast developed countries: UN classificationLebanonLesothoLiberiaLibyaLiechtensteinLithuaniaLow & middle incomeLow incomeLower middle incomeLuxembourgMacao SAR, ChinaMacedonia, FYRMadagascarMalawiMalaysiaMaldivesMaliMaltaMarshall IslandsMauritaniaMauritiusMexicoMicronesia, Fed. Sts.Middle East & North AfricaMiddle East & North Africa (excluding high income)Middle East & North Africa (IDA & IBRD countries)Middle incomeMoldovaMonacoMongoliaMontenegroMoroccoMozambiqueMyanmarNamibiaNauruNepalNetherlandsNew CaledoniaNew ZealandNicaraguaNigerNigeriaNorth AmericaNorthern Mariana IslandsNorwayOECD membersOmanOther small statesPacific island small statesPakistanPalauPanamaPapua New GuineaParaguayPeruPhilippinesPolandPortugalPost-demographic dividendPre-demographic dividendPuerto RicoQatarRomaniaRussian FederationRwandaSamoaSan MarinoSao Tome and PrincipeSaudi ArabiaSenegalSerbiaSeychellesSierra LeoneSingaporeSint Maarten (Dutch part)Slovak RepublicSloveniaSmall statesSolomon IslandsSomaliaSouth AfricaSouth AsiaSouth Asia (IDA & IBRD)South SudanSpainSri LankaSt. Kitts and NevisSt. LuciaSt. Martin (French part)St. Vincent and the GrenadinesSub-Saharan Africa Sub-Saharan Africa (excluding high income)Sub-Saharan Africa (IDA & IBRD countries)SudanSurinameSwazilandSwedenSwitzerlandSyrian Arab RepublicTajikistanTanzaniaThailandTimor-LesteTogoTongaTrinidad and TobagoTunisiaTurkeyTurkmenistanTurks and Caicos IslandsTuvaluUgandaUkraineUnited Arab EmiratesUnited KingdomUnited StatesUpper middle incomeUruguayUzbekistanVanuatuVenezuela, RBVietnamVirgin Islands (U.S.)West Bank and GazaWorldYemen, Rep.ZambiaZimbabwe Timeline:
This timeline shows a graph from 1961 to 2016 of Gabon. No data until 1960. Number of actual observations by date: 56.
Source name:
World Development Indicators
Source organization:
(1) United Nations Population Division. World Population Prospects, (2) Census reports and other statistical publications from national statistical offices, (3) Eurostat: Demographic Statistics, (4) United Nations Statistical Division. Population and Vital Statistics Report (various years), (5) U.S. Census Bureau: International Database, and (6) Secretariat of the Pacific Community: Statistics and Demography Programme.
Categories, topics:
Climate Change, Health
Last updated:
apr 23, 2017
Indicators value changes by year
Minimum:
499.189K
jan 1, 1961
Maximum:
1.725 mln
jan 1, 2016
At the date of observation
Value
Absolute change
Change from previous value
jan 1, 1961
499.189K
+499.189K
0.0%
jan 1, 1962
504.174K
+4.985K
1.0%
jan 1, 1963
509.806K
+5.632K
1.12%
jan 1, 1964
516.27K
+6.464K
1.27%
jan 1, 1965
523.793K
+7.523K
1.46%
jan 1, 1966
532.512K
+8.719K
1.66%
jan 1, 1967
542.562K
+10.05K
1.89%
jan 1, 1968
553.829K
+11.267K
2.08%
jan 1, 1969
565.878K
+12.049K
2.18%
jan 1, 1970
578.114K
+12.236K
2.16%
jan 1, 1971
590.119K
+12.005K
2.08%
jan 1, 1972
601.734K
+11.615K
1.97%
jan 1, 1973
613.129K
+11.395K
1.89%
jan 1, 1974
624.625K
+11.496K
1.87%
jan 1, 1975
636.702K
+12.077K
1.93%
jan 1, 1976
649.719K
+13.017K
2.04%
jan 1, 1977
663.774K
+14.055K
2.16%
jan 1, 1978
678.786K
+15.012K
2.26%
jan 1, 1979
694.734K
+15.948K
2.35%
jan 1, 1980
711.544K
+16.81K
2.42%
jan 1, 1981
729.165K
+17.621K
2.48%
jan 1, 1982
747.593K
+18.428K
2.53%
jan 1, 1983
766.867K
+19.274K
2.58%
jan 1, 1984
787.017K
+20.15K
2.63%
jan 1, 1985
808.088K
+21.071K
2.68%
jan 1, 1986
830.091K
+22.003K
2.72%
jan 1, 1987
853.039K
+22.948K
2.76%
jan 1, 1988
876.877K
+23.838K
2.79%
jan 1, 1989
901.473K
+24.596K
2.8%
jan 1, 1990
926.648K
+25.175K
2.79%
jan 1, 1991
952.269K
+25.621K
2.76%
jan 1, 1992
978.252K
+25.983K
2.73%
jan 1, 1993
1.005 mln
+26.346K
2.69%
jan 1, 1994
1.031 mln
+26.76K
2.66%
jan 1, 1995
1.059 mln
+27.267K
2.64%
jan 1, 1996
1.086 mln
+27.824K
2.63%
jan 1, 1997
1.115 mln
+28.43K
2.62%
jan 1, 1998
1.144 mln
+28.959K
2.6%
jan 1, 1999
1.173 mln
+29.276K
2.56%
jan 1, 2000
1.202 mln
+29.298K
2.5%
jan 1, 2001
1.232 mln
+29.136K
2.42%
jan 1, 2002
1.26 mln
+28.887K
2.35%
jan 1, 2003
1.289 mln
+28.757K
2.28%
jan 1, 2004
1.318 mln
+28.901K
2.24%
jan 1, 2005
1.348 mln
+29.431K
2.23%
jan 1, 2006
1.378 mln
+30.253K
2.25%
jan 1, 2007
1.409 mln
+31.143K
2.26%
jan 1, 2008
1.441 mln
+31.982K
2.27%
jan 1, 2009
1.474 mln
+32.839K
2.28%
jan 1, 2010
1.507 mln
+33.687K
2.29%
jan 1, 2011
1.542 mln
+34.508K
2.29%
jan 1, 2012
1.577 mln
+35.362K
2.29%
jan 1, 2013
1.613 mln
+36.191K
2.29%
jan 1, 2014
1.65 mln
+36.862K
2.28%
jan 1, 2015
1.688 mln
+37.322K
2.26%
jan 1, 2016
1.725 mln
+37.619K
2.23%
Ranking of countries by current statistics by years


Comments: