29
/
en
AIzaSyAYiBZKx7MnpbEhh9jyipgxe19OcubqV5w
April 1, 2024
105342
Chile
CHL
true
2
1
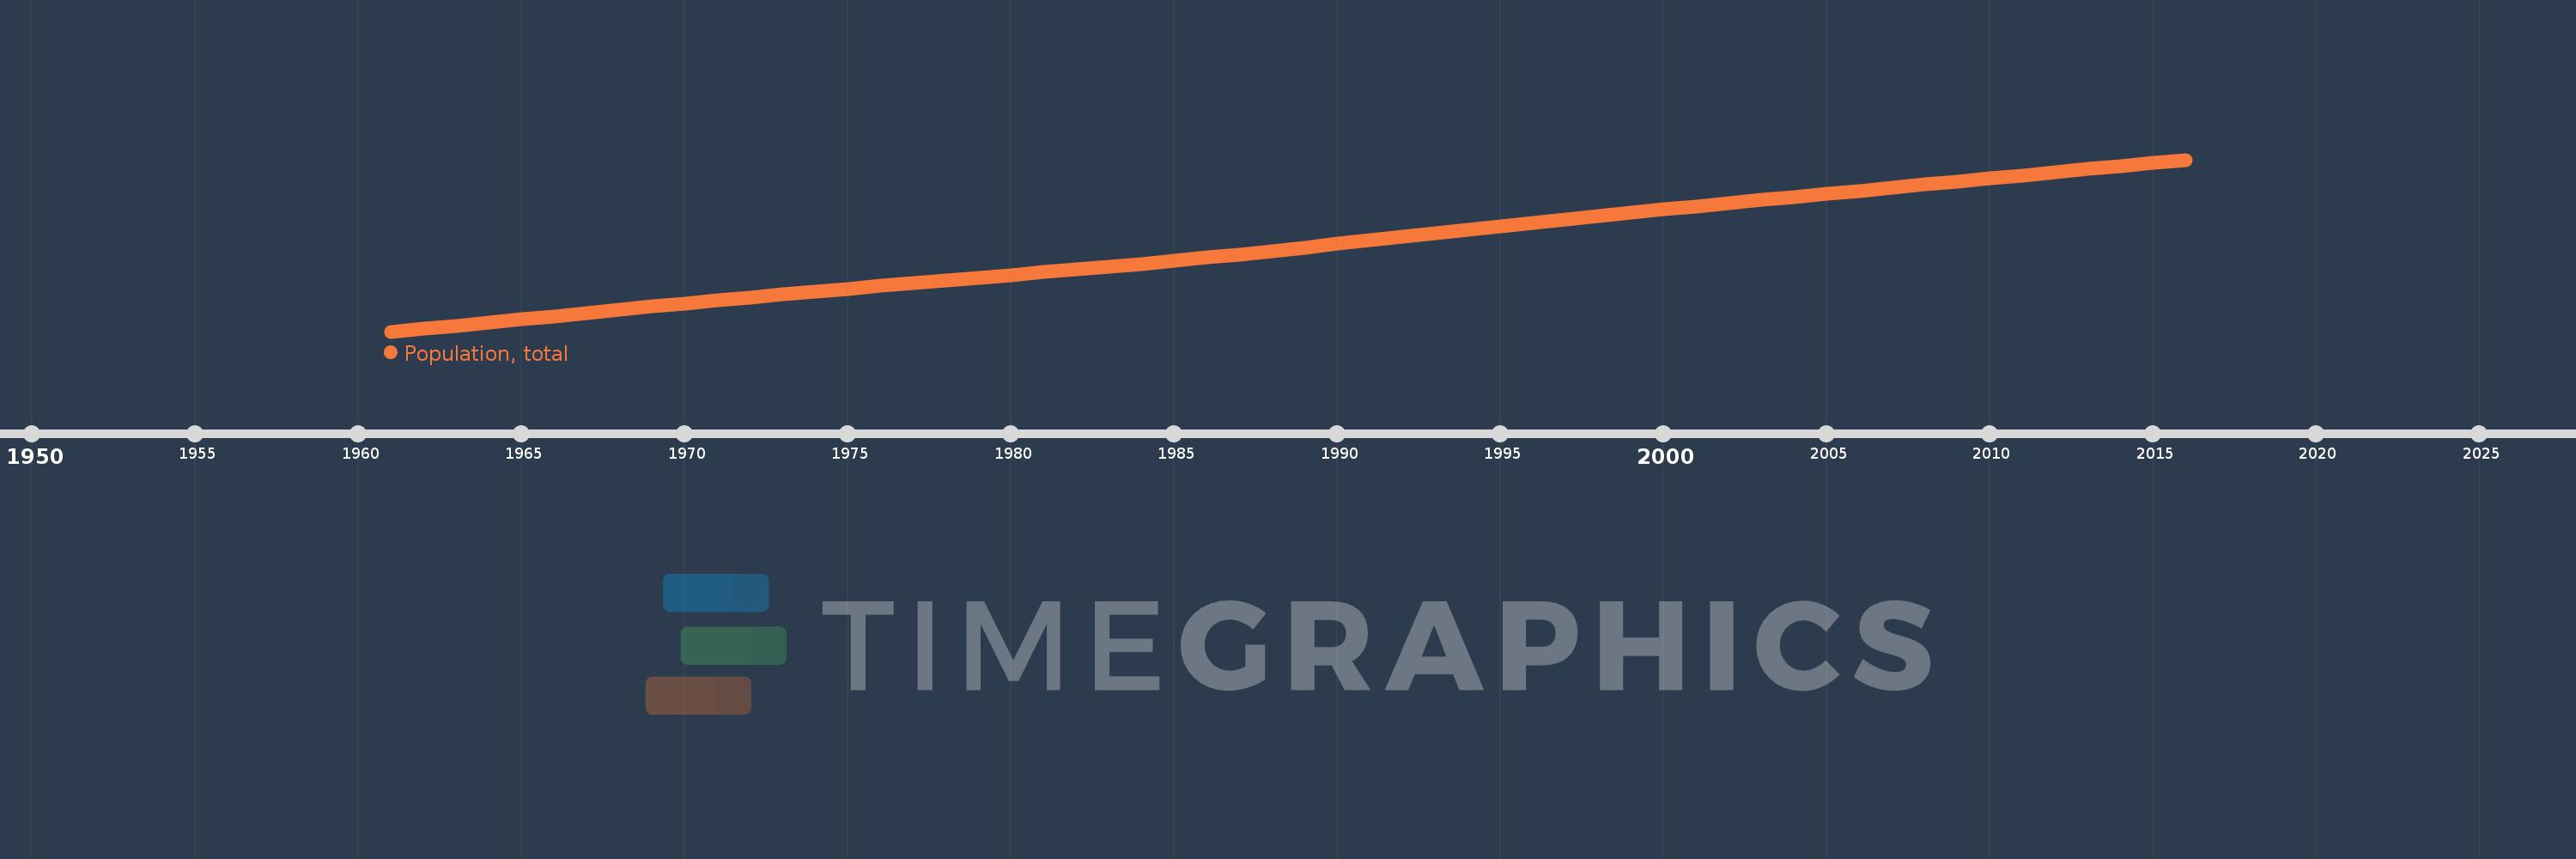
Population, total
2016,2015,2014,2013,2012,2011,2010,2009,2008,2007,2006,2005,2004,2003,2002,2001,2000,1999,1998,1997,1996,1995,1994,1993,1992,1991,1990,1989,1988,1987,1986,1985,1984,1983,1982,1981,1980,1979,1978,1977,1976,1975,1974,1973,1972,1971,1970,1969,1968,1967,1966,1965,1964,1963,1962,1961
This statistics in other country:
AfghanistanAlbaniaAlgeriaAmerican SamoaAndorraAngolaAntigua and BarbudaArab WorldArgentinaArmeniaArubaAustraliaAustriaAzerbaijanBahamas, TheBahrainBangladeshBarbadosBelarusBelgiumBelizeBeninBermudaBhutanBoliviaBosnia and HerzegovinaBotswanaBrazilBritish Virgin IslandsBrunei DarussalamBulgariaBurkina FasoBurundiCabo VerdeCambodiaCameroonCanadaCaribbean small statesCayman IslandsCentral African RepublicCentral Europe and the BalticsChadChannel IslandsChileChinaColombiaComorosCongo, Dem. Rep.Congo, Rep.Costa RicaCote d'IvoireCroatiaCubaCuracaoCyprusCzech RepublicDenmarkDjiboutiDominicaDominican RepublicEarly-demographic dividendEast Asia & PacificEast Asia & Pacific (excluding high income)East Asia & Pacific (IDA & IBRD countries)EcuadorEgypt, Arab Rep.El SalvadorEquatorial GuineaEritreaEstoniaEthiopiaEuro areaEurope & Central AsiaEurope & Central Asia (excluding high income)Europe & Central Asia (IDA & IBRD countries)European UnionFaroe IslandsFijiFinlandFragile and conflict affected situationsFranceFrench PolynesiaGabonGambia, TheGeorgiaGermanyGhanaGibraltarGreeceGreenlandGrenadaGuamGuatemalaGuineaGuinea-BissauGuyanaHaitiHeavily indebted poor countries (HIPC)High incomeHondurasHong Kong SAR, ChinaHungaryIBRD onlyIcelandIDA & IBRD totalIDA blendIDA onlyIDA totalIndiaIndonesiaIran, Islamic Rep.IraqIrelandIsle of ManIsraelItalyJamaicaJapanJordanKazakhstanKenyaKiribatiKorea, Dem. People’s Rep.Korea, Rep.KosovoKuwaitKyrgyz RepublicLao PDRLate-demographic dividendLatin America & Caribbean Latin America & Caribbean (excluding high income)Latin America & the Caribbean (IDA & IBRD countries)LatviaLeast developed countries: UN classificationLebanonLesothoLiberiaLibyaLiechtensteinLithuaniaLow & middle incomeLow incomeLower middle incomeLuxembourgMacao SAR, ChinaMacedonia, FYRMadagascarMalawiMalaysiaMaldivesMaliMaltaMarshall IslandsMauritaniaMauritiusMexicoMicronesia, Fed. Sts.Middle East & North AfricaMiddle East & North Africa (excluding high income)Middle East & North Africa (IDA & IBRD countries)Middle incomeMoldovaMonacoMongoliaMontenegroMoroccoMozambiqueMyanmarNamibiaNauruNepalNetherlandsNew CaledoniaNew ZealandNicaraguaNigerNigeriaNorth AmericaNorthern Mariana IslandsNorwayOECD membersOmanOther small statesPacific island small statesPakistanPalauPanamaPapua New GuineaParaguayPeruPhilippinesPolandPortugalPost-demographic dividendPre-demographic dividendPuerto RicoQatarRomaniaRussian FederationRwandaSamoaSan MarinoSao Tome and PrincipeSaudi ArabiaSenegalSerbiaSeychellesSierra LeoneSingaporeSint Maarten (Dutch part)Slovak RepublicSloveniaSmall statesSolomon IslandsSomaliaSouth AfricaSouth AsiaSouth Asia (IDA & IBRD)South SudanSpainSri LankaSt. Kitts and NevisSt. LuciaSt. Martin (French part)St. Vincent and the GrenadinesSub-Saharan Africa Sub-Saharan Africa (excluding high income)Sub-Saharan Africa (IDA & IBRD countries)SudanSurinameSwazilandSwedenSwitzerlandSyrian Arab RepublicTajikistanTanzaniaThailandTimor-LesteTogoTongaTrinidad and TobagoTunisiaTurkeyTurkmenistanTurks and Caicos IslandsTuvaluUgandaUkraineUnited Arab EmiratesUnited KingdomUnited StatesUpper middle incomeUruguayUzbekistanVanuatuVenezuela, RBVietnamVirgin Islands (U.S.)West Bank and GazaWorldYemen, Rep.ZambiaZimbabwe Timeline:
This timeline shows a graph from 1961 to 2016 of Chile. No data until 1960. Number of actual observations by date: 56.
Source name:
World Development Indicators
Source organization:
(1) United Nations Population Division. World Population Prospects, (2) Census reports and other statistical publications from national statistical offices, (3) Eurostat: Demographic Statistics, (4) United Nations Statistical Division. Population and Vital Statistics Report (various years), (5) U.S. Census Bureau: International Database, and (6) Secretariat of the Pacific Community: Statistics and Demography Programme.
Categories, topics:
Climate Change, Health
Last updated:
apr 23, 2017
Indicators value changes by year
Minimum:
7.696 mln
jan 1, 1961
Maximum:
17.948 mln
jan 1, 2016
At the date of observation
Value
Absolute change
Change from previous value
jan 1, 1961
7.696 mln
+7.696 mln
0.0%
jan 1, 1962
7.874 mln
+177.812K
2.31%
jan 1, 1963
8.054 mln
+180.662K
2.29%
jan 1, 1964
8.238 mln
+183.389K
2.28%
jan 1, 1965
8.424 mln
+186.059K
2.26%
jan 1, 1966
8.612 mln
+188.46K
2.24%
jan 1, 1967
8.803 mln
+190.852K
2.22%
jan 1, 1968
8.995 mln
+192.484K
2.19%
jan 1, 1969
9.188 mln
+192.182K
2.14%
jan 1, 1970
9.377 mln
+189.413K
2.06%
jan 1, 1971
9.562 mln
+184.863K
1.97%
jan 1, 1972
9.742 mln
+179.711K
1.88%
jan 1, 1973
9.917 mln
+174.979K
1.8%
jan 1, 1974
10.087 mln
+170.819K
1.72%
jan 1, 1975
10.255 mln
+167.697K
1.66%
jan 1, 1976
10.421 mln
+165.516K
1.61%
jan 1, 1977
10.584 mln
+163.647K
1.57%
jan 1, 1978
10.746 mln
+162.091K
1.53%
jan 1, 1979
10.908 mln
+161.573K
1.5%
jan 1, 1980
11.07 mln
+162.297K
1.49%
jan 1, 1981
11.234 mln
+164.142K
1.48%
jan 1, 1982
11.4 mln
+166.149K
1.48%
jan 1, 1983
11.569 mln
+168.646K
1.48%
jan 1, 1984
11.742 mln
+172.922K
1.49%
jan 1, 1985
11.921 mln
+179.35K
1.53%
jan 1, 1986
12.109 mln
+187.169K
1.57%
jan 1, 1987
12.304 mln
+195.627K
1.62%
jan 1, 1988
12.507 mln
+203.285K
1.65%
jan 1, 1989
12.717 mln
+209.02K
1.67%
jan 1, 1990
12.928 mln
+211.983K
1.67%
jan 1, 1991
13.141 mln
+212.711K
1.65%
jan 1, 1992
13.354 mln
+212.852K
1.62%
jan 1, 1993
13.567 mln
+212.888K
1.59%
jan 1, 1994
13.779 mln
+211.734K
1.56%
jan 1, 1995
13.988 mln
+209.323K
1.52%
jan 1, 1996
14.194 mln
+205.987K
1.47%
jan 1, 1997
14.396 mln
+202.034K
1.42%
jan 1, 1998
14.594 mln
+198.05K
1.38%
jan 1, 1999
14.789 mln
+194.539K
1.33%
jan 1, 2000
14.98 mln
+191.875K
1.3%
jan 1, 2001
15.17 mln
+189.903K
1.27%
jan 1, 2002
15.358 mln
+188.031K
1.24%
jan 1, 2003
15.545 mln
+186.136K
1.21%
jan 1, 2004
15.729 mln
+184.714K
1.19%
jan 1, 2005
15.913 mln
+183.851K
1.17%
jan 1, 2006
16.097 mln
+183.452K
1.15%
jan 1, 2007
16.28 mln
+183.157K
1.14%
jan 1, 2008
16.463 mln
+182.973K
1.12%
jan 1, 2009
16.646 mln
+183.239K
1.11%
jan 1, 2010
16.83 mln
+184.017K
1.11%
jan 1, 2011
17.015 mln
+185.091K
1.1%
jan 1, 2012
17.201 mln
+186.257K
1.09%
jan 1, 2013
17.388 mln
+187.132K
1.09%
jan 1, 2014
17.576 mln
+187.396K
1.08%
jan 1, 2015
17.763 mln
+186.814K
1.06%
jan 1, 2016
17.948 mln
+185.494K
1.04%
Ranking of countries by current statistics by years


Comments: