29
/
en
AIzaSyAYiBZKx7MnpbEhh9jyipgxe19OcubqV5w
April 1, 2024
32019
Europe & Central Asia (excluding high income)
ECA
false
2
1
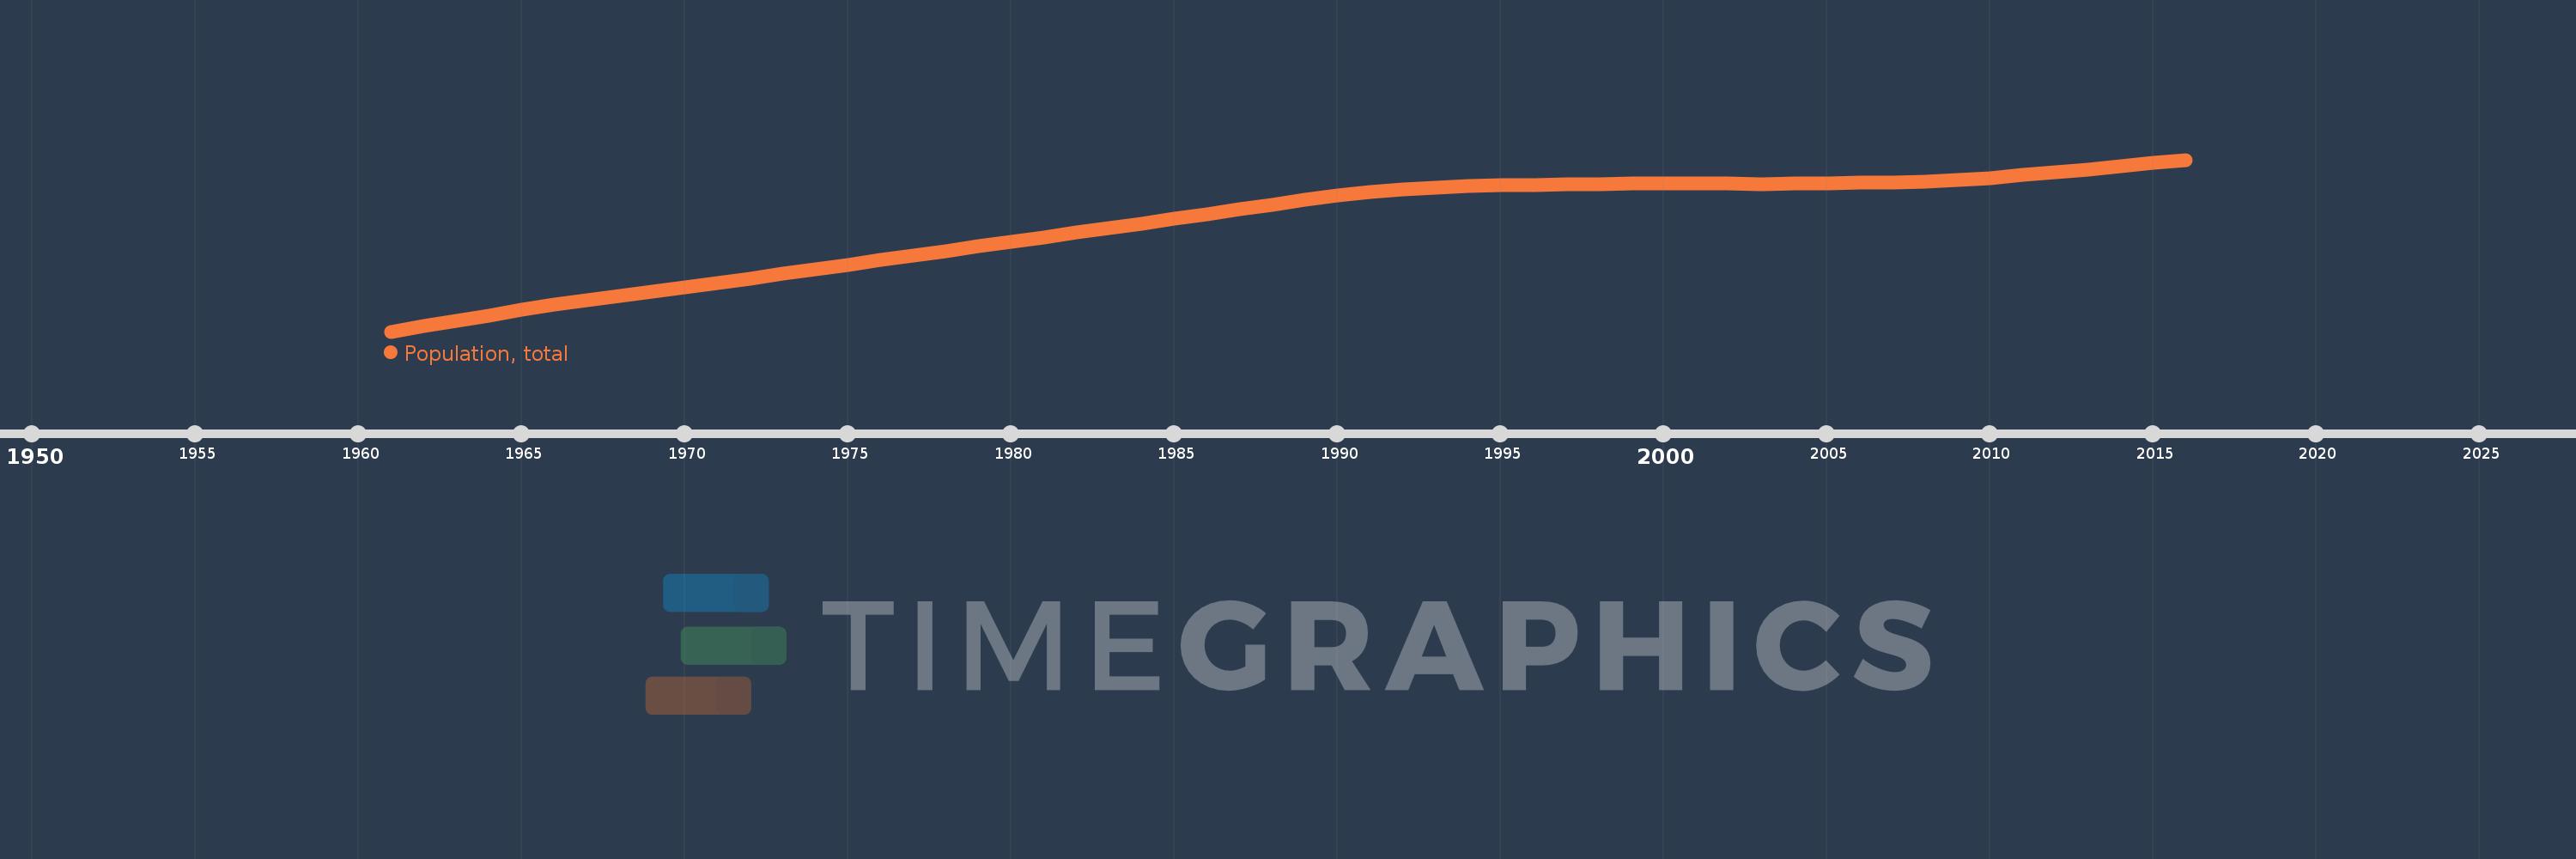
Population, total
2016,2015,2014,2013,2012,2011,2010,2009,2008,2007,2006,2005,2004,2003,2002,2001,2000,1999,1998,1997,1996,1995,1994,1993,1992,1991,1990,1989,1988,1987,1986,1985,1984,1983,1982,1981,1980,1979,1978,1977,1976,1975,1974,1973,1972,1971,1970,1969,1968,1967,1966,1965,1964,1963,1962,1961
This statistics in other country:
AfghanistanAlbaniaAlgeriaAmerican SamoaAndorraAngolaAntigua and BarbudaArab WorldArgentinaArmeniaArubaAustraliaAustriaAzerbaijanBahamas, TheBahrainBangladeshBarbadosBelarusBelgiumBelizeBeninBermudaBhutanBoliviaBosnia and HerzegovinaBotswanaBrazilBritish Virgin IslandsBrunei DarussalamBulgariaBurkina FasoBurundiCabo VerdeCambodiaCameroonCanadaCaribbean small statesCayman IslandsCentral African RepublicCentral Europe and the BalticsChadChannel IslandsChileChinaColombiaComorosCongo, Dem. Rep.Congo, Rep.Costa RicaCote d'IvoireCroatiaCubaCuracaoCyprusCzech RepublicDenmarkDjiboutiDominicaDominican RepublicEarly-demographic dividendEast Asia & PacificEast Asia & Pacific (excluding high income)East Asia & Pacific (IDA & IBRD countries)EcuadorEgypt, Arab Rep.El SalvadorEquatorial GuineaEritreaEstoniaEthiopiaEuro areaEurope & Central AsiaEurope & Central Asia (excluding high income)Europe & Central Asia (IDA & IBRD countries)European UnionFaroe IslandsFijiFinlandFragile and conflict affected situationsFranceFrench PolynesiaGabonGambia, TheGeorgiaGermanyGhanaGibraltarGreeceGreenlandGrenadaGuamGuatemalaGuineaGuinea-BissauGuyanaHaitiHeavily indebted poor countries (HIPC)High incomeHondurasHong Kong SAR, ChinaHungaryIBRD onlyIcelandIDA & IBRD totalIDA blendIDA onlyIDA totalIndiaIndonesiaIran, Islamic Rep.IraqIrelandIsle of ManIsraelItalyJamaicaJapanJordanKazakhstanKenyaKiribatiKorea, Dem. People’s Rep.Korea, Rep.KosovoKuwaitKyrgyz RepublicLao PDRLate-demographic dividendLatin America & Caribbean Latin America & Caribbean (excluding high income)Latin America & the Caribbean (IDA & IBRD countries)LatviaLeast developed countries: UN classificationLebanonLesothoLiberiaLibyaLiechtensteinLithuaniaLow & middle incomeLow incomeLower middle incomeLuxembourgMacao SAR, ChinaMacedonia, FYRMadagascarMalawiMalaysiaMaldivesMaliMaltaMarshall IslandsMauritaniaMauritiusMexicoMicronesia, Fed. Sts.Middle East & North AfricaMiddle East & North Africa (excluding high income)Middle East & North Africa (IDA & IBRD countries)Middle incomeMoldovaMonacoMongoliaMontenegroMoroccoMozambiqueMyanmarNamibiaNauruNepalNetherlandsNew CaledoniaNew ZealandNicaraguaNigerNigeriaNorth AmericaNorthern Mariana IslandsNorwayOECD membersOmanOther small statesPacific island small statesPakistanPalauPanamaPapua New GuineaParaguayPeruPhilippinesPolandPortugalPost-demographic dividendPre-demographic dividendPuerto RicoQatarRomaniaRussian FederationRwandaSamoaSan MarinoSao Tome and PrincipeSaudi ArabiaSenegalSerbiaSeychellesSierra LeoneSingaporeSint Maarten (Dutch part)Slovak RepublicSloveniaSmall statesSolomon IslandsSomaliaSouth AfricaSouth AsiaSouth Asia (IDA & IBRD)South SudanSpainSri LankaSt. Kitts and NevisSt. LuciaSt. Martin (French part)St. Vincent and the GrenadinesSub-Saharan Africa Sub-Saharan Africa (excluding high income)Sub-Saharan Africa (IDA & IBRD countries)SudanSurinameSwazilandSwedenSwitzerlandSyrian Arab RepublicTajikistanTanzaniaThailandTimor-LesteTogoTongaTrinidad and TobagoTunisiaTurkeyTurkmenistanTurks and Caicos IslandsTuvaluUgandaUkraineUnited Arab EmiratesUnited KingdomUnited StatesUpper middle incomeUruguayUzbekistanVanuatuVenezuela, RBVietnamVirgin Islands (U.S.)West Bank and GazaWorldYemen, Rep.ZambiaZimbabwe Timeline:
This timeline shows a graph from 1961 to 2016 of Europe & Central Asia (excluding high income). No data until 1960. Number of actual observations by date: 56.
Source name:
World Development Indicators
Source organization:
(1) United Nations Population Division. World Population Prospects, (2) Census reports and other statistical publications from national statistical offices, (3) Eurostat: Demographic Statistics, (4) United Nations Statistical Division. Population and Vital Statistics Report (various years), (5) U.S. Census Bureau: International Database, and (6) Secretariat of the Pacific Community: Statistics and Demography Programme.
Categories, topics:
Climate Change, Health
Last updated:
apr 23, 2017
Indicators value changes by year
Minimum:
275.221 mln
jan 1, 1961
Maximum:
411.338 mln
jan 1, 2016
At the date of observation
Value
Absolute change
Change from previous value
jan 1, 1961
275.221 mln
+275.221 mln
0.0%
jan 1, 1962
279.489 mln
+4.268 mln
1.55%
jan 1, 1963
283.776 mln
+4.287 mln
1.53%
jan 1, 1964
288.075 mln
+4.299 mln
1.51%
jan 1, 1965
292.347 mln
+4.272 mln
1.48%
jan 1, 1966
296.539 mln
+4.192 mln
1.43%
jan 1, 1967
300.049 mln
+3.51 mln
1.18%
jan 1, 1968
303.611 mln
+3.562 mln
1.19%
jan 1, 1969
307.088 mln
+3.477 mln
1.15%
jan 1, 1970
310.521 mln
+3.434 mln
1.12%
jan 1, 1971
313.855 mln
+3.333 mln
1.07%
jan 1, 1972
317.387 mln
+3.532 mln
1.13%
jan 1, 1973
321.11 mln
+3.723 mln
1.17%
jan 1, 1974
324.68 mln
+3.57 mln
1.11%
jan 1, 1975
328.259 mln
+3.579 mln
1.1%
jan 1, 1976
331.829 mln
+3.57 mln
1.09%
jan 1, 1977
335.514 mln
+3.686 mln
1.11%
jan 1, 1978
339.111 mln
+3.596 mln
1.07%
jan 1, 1979
342.651 mln
+3.541 mln
1.04%
jan 1, 1980
346.176 mln
+3.525 mln
1.03%
jan 1, 1981
349.819 mln
+3.643 mln
1.05%
jan 1, 1982
353.552 mln
+3.732 mln
1.07%
jan 1, 1983
357.125 mln
+3.573 mln
1.01%
jan 1, 1984
360.692 mln
+3.567 mln
1.0%
jan 1, 1985
364.508 mln
+3.816 mln
1.06%
jan 1, 1986
368.335 mln
+3.827 mln
1.05%
jan 1, 1987
372.131 mln
+3.796 mln
1.03%
jan 1, 1988
375.91 mln
+3.78 mln
1.02%
jan 1, 1989
379.565 mln
+3.655 mln
0.97%
jan 1, 1990
383.041 mln
+3.477 mln
0.92%
jan 1, 1991
385.568 mln
+2.527 mln
0.66%
jan 1, 1992
387.534 mln
+1.966 mln
0.51%
jan 1, 1993
389.133 mln
+1.598 mln
0.41%
jan 1, 1994
390.364 mln
+1.231 mln
0.32%
jan 1, 1995
390.991 mln
+626.844K
0.16%
jan 1, 1996
391.432 mln
+441.433K
0.11%
jan 1, 1997
391.817 mln
+384.817K
0.1%
jan 1, 1998
392.207 mln
+390.335K
0.1%
jan 1, 1999
392.488 mln
+280.456K
0.07%
jan 1, 2000
392.502 mln
+14.451K
0.0%
jan 1, 2001
392.649 mln
+146.49K
0.04%
jan 1, 2002
392.416 mln
-233.011K
-0.06%
jan 1, 2003
392.122 mln
-293.085K
-0.07%
jan 1, 2004
392.289 mln
+166.259K
0.04%
jan 1, 2005
392.654 mln
+365.77K
0.09%
jan 1, 2006
393.078 mln
+423.043K
0.11%
jan 1, 2007
393.637 mln
+559.584K
0.14%
jan 1, 2008
394.217 mln
+580.041K
0.15%
jan 1, 2009
395.266 mln
+1.049 mln
0.27%
jan 1, 2010
397.038 mln
+1.772 mln
0.45%
jan 1, 2011
399.122 mln
+2.084 mln
0.52%
jan 1, 2012
401.448 mln
+2.326 mln
0.58%
jan 1, 2013
403.831 mln
+2.382 mln
0.59%
jan 1, 2014
406.425 mln
+2.594 mln
0.64%
jan 1, 2015
408.984 mln
+2.559 mln
0.63%
jan 1, 2016
411.338 mln
+2.354 mln
0.58%
Ranking of countries by current statistics by years


Comments: