29
/
en
AIzaSyAYiBZKx7MnpbEhh9jyipgxe19OcubqV5w
April 1, 2024
40997
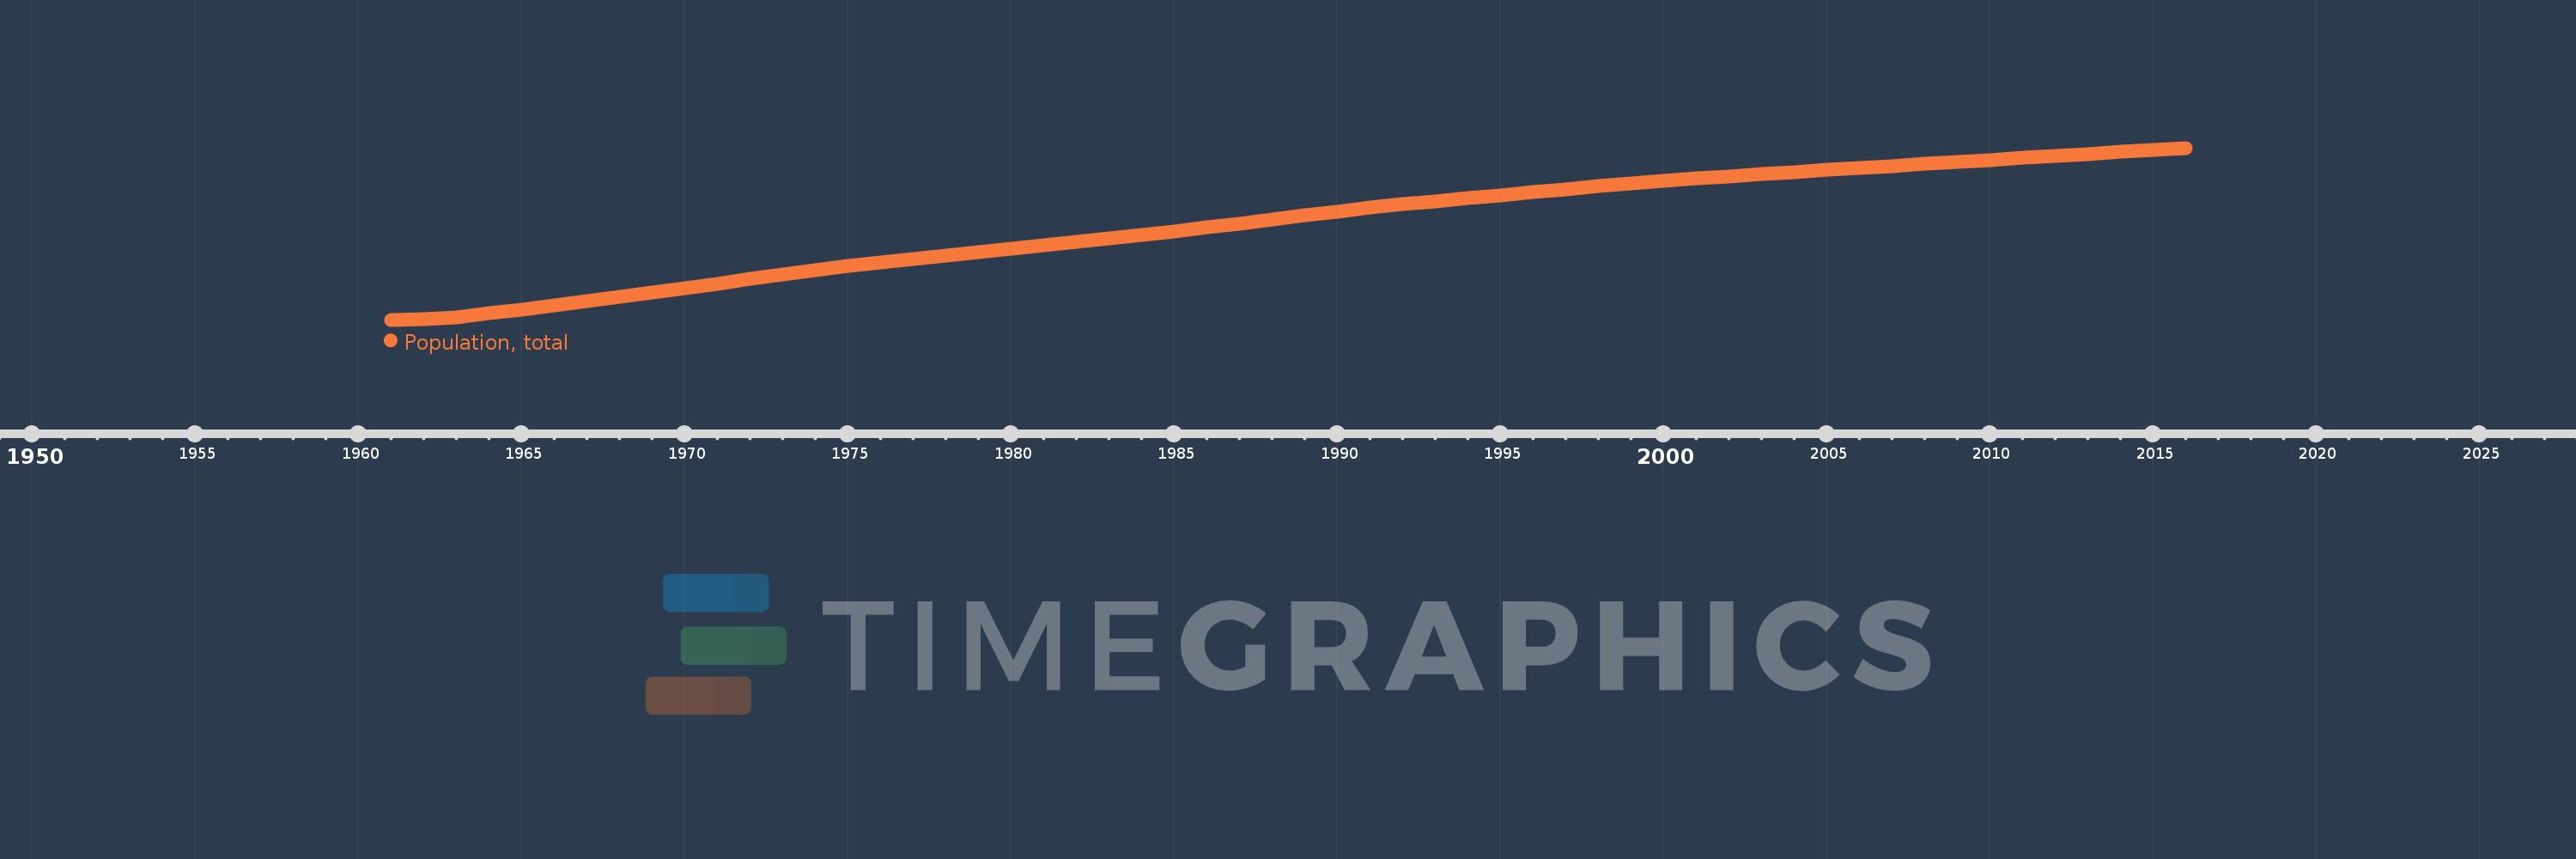
Late-demographic dividend
LTE
false
2
1
Population, total
2016,2015,2014,2013,2012,2011,2010,2009,2008,2007,2006,2005,2004,2003,2002,2001,2000,1999,1998,1997,1996,1995,1994,1993,1992,1991,1990,1989,1988,1987,1986,1985,1984,1983,1982,1981,1980,1979,1978,1977,1976,1975,1974,1973,1972,1971,1970,1969,1968,1967,1966,1965,1964,1963,1962,1961
This statistics in other country:
AfghanistanAlbaniaAlgeriaAmerican SamoaAndorraAngolaAntigua and BarbudaArab WorldArgentinaArmeniaArubaAustraliaAustriaAzerbaijanBahamas, TheBahrainBangladeshBarbadosBelarusBelgiumBelizeBeninBermudaBhutanBoliviaBosnia and HerzegovinaBotswanaBrazilBritish Virgin IslandsBrunei DarussalamBulgariaBurkina FasoBurundiCabo VerdeCambodiaCameroonCanadaCaribbean small statesCayman IslandsCentral African RepublicCentral Europe and the BalticsChadChannel IslandsChileChinaColombiaComorosCongo, Dem. Rep.Congo, Rep.Costa RicaCote d'IvoireCroatiaCubaCuracaoCyprusCzech RepublicDenmarkDjiboutiDominicaDominican RepublicEarly-demographic dividendEast Asia & PacificEast Asia & Pacific (excluding high income)East Asia & Pacific (IDA & IBRD countries)EcuadorEgypt, Arab Rep.El SalvadorEquatorial GuineaEritreaEstoniaEthiopiaEuro areaEurope & Central AsiaEurope & Central Asia (excluding high income)Europe & Central Asia (IDA & IBRD countries)European UnionFaroe IslandsFijiFinlandFragile and conflict affected situationsFranceFrench PolynesiaGabonGambia, TheGeorgiaGermanyGhanaGibraltarGreeceGreenlandGrenadaGuamGuatemalaGuineaGuinea-BissauGuyanaHaitiHeavily indebted poor countries (HIPC)High incomeHondurasHong Kong SAR, ChinaHungaryIBRD onlyIcelandIDA & IBRD totalIDA blendIDA onlyIDA totalIndiaIndonesiaIran, Islamic Rep.IraqIrelandIsle of ManIsraelItalyJamaicaJapanJordanKazakhstanKenyaKiribatiKorea, Dem. People’s Rep.Korea, Rep.KosovoKuwaitKyrgyz RepublicLao PDRLate-demographic dividendLatin America & Caribbean Latin America & Caribbean (excluding high income)Latin America & the Caribbean (IDA & IBRD countries)LatviaLeast developed countries: UN classificationLebanonLesothoLiberiaLibyaLiechtensteinLithuaniaLow & middle incomeLow incomeLower middle incomeLuxembourgMacao SAR, ChinaMacedonia, FYRMadagascarMalawiMalaysiaMaldivesMaliMaltaMarshall IslandsMauritaniaMauritiusMexicoMicronesia, Fed. Sts.Middle East & North AfricaMiddle East & North Africa (excluding high income)Middle East & North Africa (IDA & IBRD countries)Middle incomeMoldovaMonacoMongoliaMontenegroMoroccoMozambiqueMyanmarNamibiaNauruNepalNetherlandsNew CaledoniaNew ZealandNicaraguaNigerNigeriaNorth AmericaNorthern Mariana IslandsNorwayOECD membersOmanOther small statesPacific island small statesPakistanPalauPanamaPapua New GuineaParaguayPeruPhilippinesPolandPortugalPost-demographic dividendPre-demographic dividendPuerto RicoQatarRomaniaRussian FederationRwandaSamoaSan MarinoSao Tome and PrincipeSaudi ArabiaSenegalSerbiaSeychellesSierra LeoneSingaporeSint Maarten (Dutch part)Slovak RepublicSloveniaSmall statesSolomon IslandsSomaliaSouth AfricaSouth AsiaSouth Asia (IDA & IBRD)South SudanSpainSri LankaSt. Kitts and NevisSt. LuciaSt. Martin (French part)St. Vincent and the GrenadinesSub-Saharan Africa Sub-Saharan Africa (excluding high income)Sub-Saharan Africa (IDA & IBRD countries)SudanSurinameSwazilandSwedenSwitzerlandSyrian Arab RepublicTajikistanTanzaniaThailandTimor-LesteTogoTongaTrinidad and TobagoTunisiaTurkeyTurkmenistanTurks and Caicos IslandsTuvaluUgandaUkraineUnited Arab EmiratesUnited KingdomUnited StatesUpper middle incomeUruguayUzbekistanVanuatuVenezuela, RBVietnamVirgin Islands (U.S.)West Bank and GazaWorldYemen, Rep.ZambiaZimbabwe Timeline:
This timeline shows a graph from 1961 to 2016 of Late-demographic dividend. No data until 1960. Number of actual observations by date: 56.
Source name:
World Development Indicators
Source organization:
(1) United Nations Population Division. World Population Prospects, (2) Census reports and other statistical publications from national statistical offices, (3) Eurostat: Demographic Statistics, (4) United Nations Statistical Division. Population and Vital Statistics Report (various years), (5) U.S. Census Bureau: International Database, and (6) Secretariat of the Pacific Community: Statistics and Demography Programme.
Categories, topics:
Climate Change, Health
Last updated:
apr 23, 2017
Indicators value changes by year
Minimum:
1.1 bln
jan 1, 1961
Maximum:
2.249 bln
jan 1, 2016
At the date of observation
Value
Absolute change
Change from previous value
jan 1, 1961
1.1 bln
+1.1 bln
0.0%
jan 1, 1962
1.102 bln
+2.202 mln
0.2%
jan 1, 1963
1.116 bln
+14.478 mln
1.31%
jan 1, 1964
1.142 bln
+25.666 mln
2.3%
jan 1, 1965
1.167 bln
+25.418 mln
2.23%
jan 1, 1966
1.193 bln
+26.077 mln
2.23%
jan 1, 1967
1.222 bln
+28.833 mln
2.42%
jan 1, 1968
1.25 bln
+27.975 mln
2.29%
jan 1, 1969
1.279 bln
+28.806 mln
2.3%
jan 1, 1970
1.309 bln
+30.3 mln
2.37%
jan 1, 1971
1.34 bln
+30.892 mln
2.36%
jan 1, 1972
1.372 bln
+31.557 mln
2.35%
jan 1, 1973
1.402 bln
+30.107 mln
2.19%
jan 1, 1974
1.431 bln
+29.098 mln
2.08%
jan 1, 1975
1.459 bln
+27.665 mln
1.93%
jan 1, 1976
1.484 bln
+25.438 mln
1.74%
jan 1, 1977
1.508 bln
+23.904 mln
1.61%
jan 1, 1978
1.53 bln
+22.346 mln
1.48%
jan 1, 1979
1.553 bln
+22.299 mln
1.46%
jan 1, 1980
1.575 bln
+22.508 mln
1.45%
jan 1, 1981
1.597 bln
+22.068 mln
1.4%
jan 1, 1982
1.62 bln
+22.31 mln
1.4%
jan 1, 1983
1.644 bln
+24.491 mln
1.51%
jan 1, 1984
1.668 bln
+24.427 mln
1.49%
jan 1, 1985
1.692 bln
+23.524 mln
1.41%
jan 1, 1986
1.716 bln
+24.426 mln
1.44%
jan 1, 1987
1.742 bln
+26.069 mln
1.52%
jan 1, 1988
1.77 bln
+27.53 mln
1.58%
jan 1, 1989
1.798 bln
+27.622 mln
1.56%
jan 1, 1990
1.824 bln
+26.772 mln
1.49%
jan 1, 1991
1.85 bln
+25.253 mln
1.38%
jan 1, 1992
1.873 bln
+23.499 mln
1.27%
jan 1, 1993
1.893 bln
+19.519 mln
1.04%
jan 1, 1994
1.913 bln
+20.344 mln
1.07%
jan 1, 1995
1.933 bln
+20.08 mln
1.05%
jan 1, 1996
1.954 bln
+21.259 mln
1.1%
jan 1, 1997
1.974 bln
+19.195 mln
0.98%
jan 1, 1998
1.993 bln
+19.052 mln
0.97%
jan 1, 1999
2.011 bln
+18.464 mln
0.93%
jan 1, 2000
2.028 bln
+17.346 mln
0.86%
jan 1, 2001
2.044 bln
+15.869 mln
0.78%
jan 1, 2002
2.06 bln
+15.229 mln
0.74%
jan 1, 2003
2.074 bln
+14.415 mln
0.7%
jan 1, 2004
2.088 bln
+14.112 mln
0.68%
jan 1, 2005
2.102 bln
+13.962 mln
0.67%
jan 1, 2006
2.116 bln
+13.92 mln
0.66%
jan 1, 2007
2.129 bln
+13.555 mln
0.64%
jan 1, 2008
2.143 bln
+13.063 mln
0.61%
jan 1, 2009
2.156 bln
+13.133 mln
0.61%
jan 1, 2010
2.169 bln
+13.445 mln
0.62%
jan 1, 2011
2.182 bln
+12.929 mln
0.6%
jan 1, 2012
2.195 bln
+13.131 mln
0.6%
jan 1, 2013
2.209 bln
+13.438 mln
0.61%
jan 1, 2014
2.222 bln
+13.552 mln
0.61%
jan 1, 2015
2.236 bln
+13.605 mln
0.61%
jan 1, 2016
2.249 bln
+13.368 mln
0.6%
Ranking of countries by current statistics by years


Comments: