29
/fr/
fr
AIzaSyAYiBZKx7MnpbEhh9jyipgxe19OcubqV5w
April 1, 2024
51314
Middle income
MIC
false
2
1
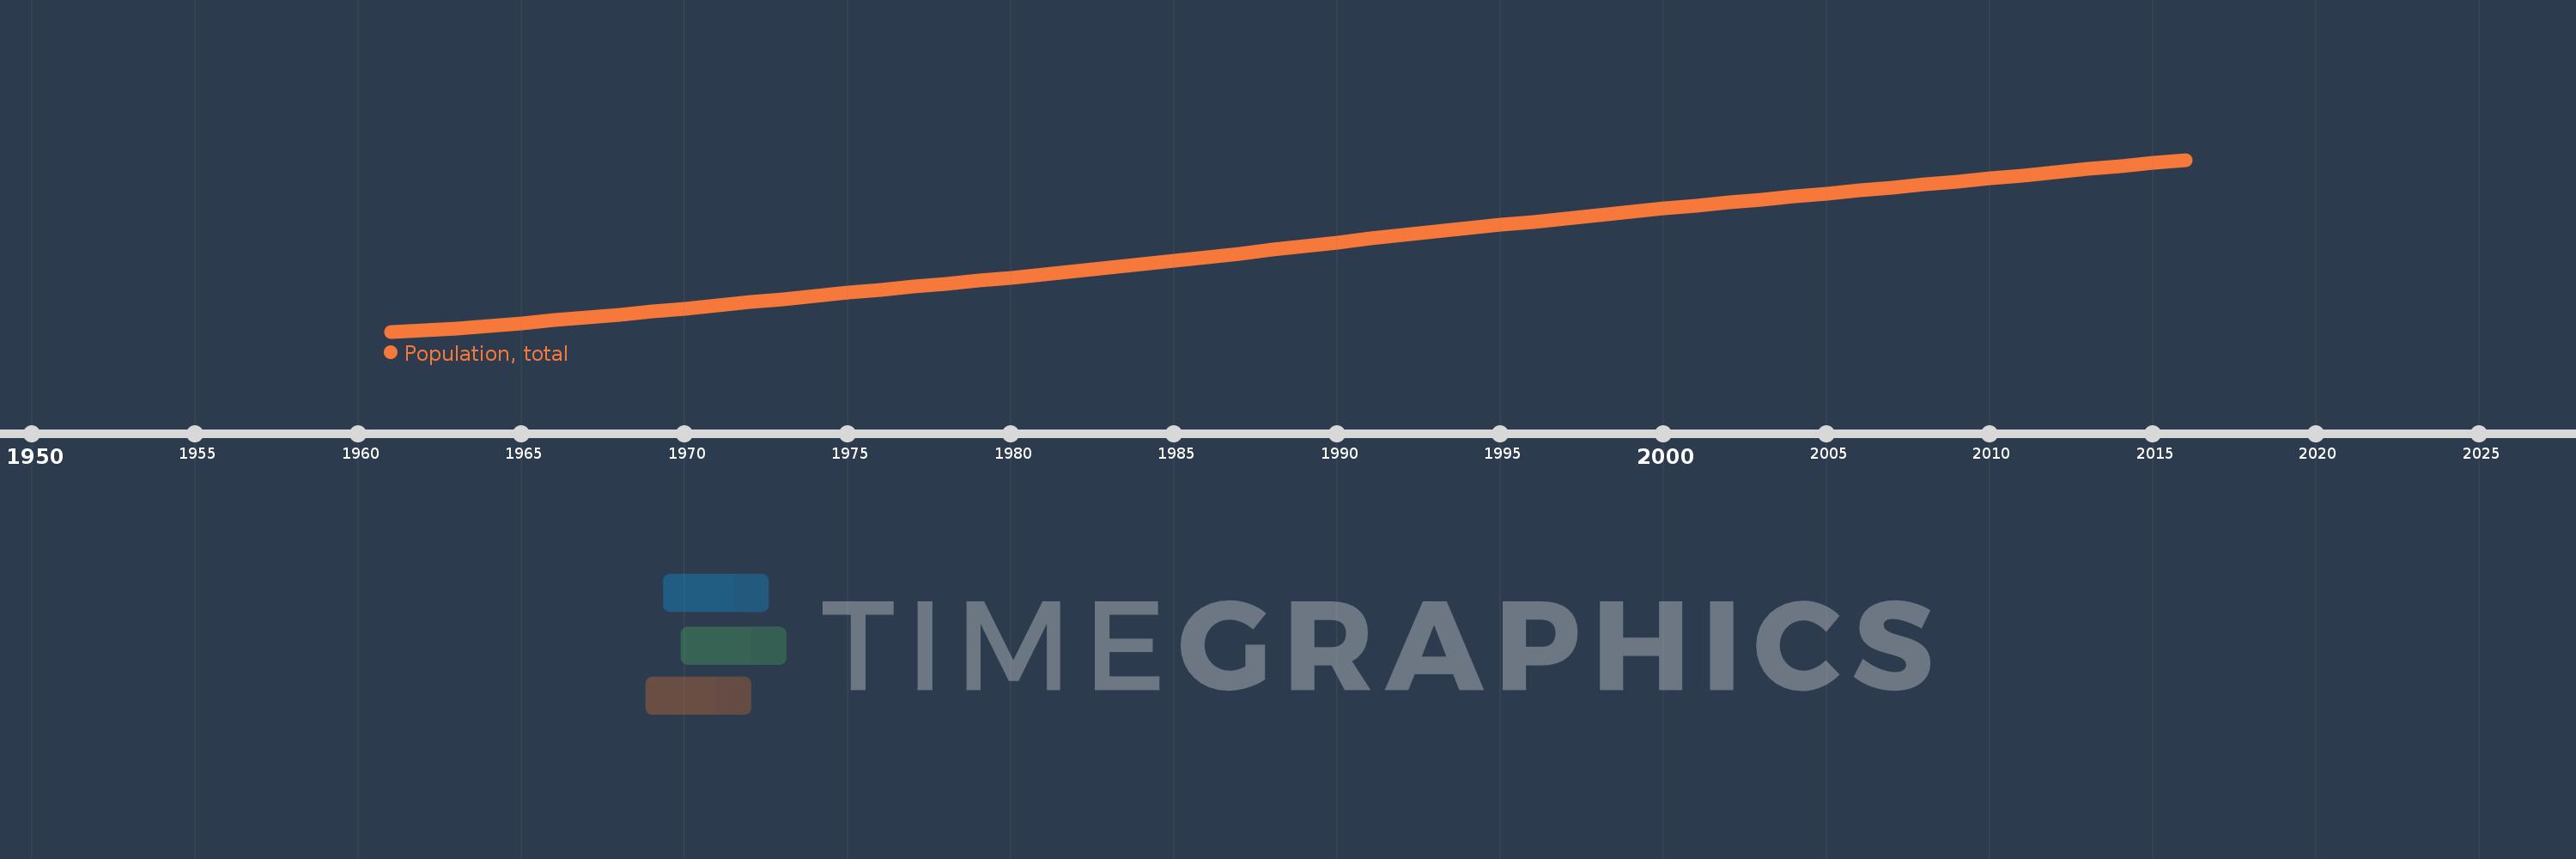
Population, total
2016,2015,2014,2013,2012,2011,2010,2009,2008,2007,2006,2005,2004,2003,2002,2001,2000,1999,1998,1997,1996,1995,1994,1993,1992,1991,1990,1989,1988,1987,1986,1985,1984,1983,1982,1981,1980,1979,1978,1977,1976,1975,1974,1973,1972,1971,1970,1969,1968,1967,1966,1965,1964,1963,1962,1961
Cette statistique dans les autres pays:
AfghanistanAlbaniaAlgeriaAmerican SamoaAndorraAngolaAntigua and BarbudaArab WorldArgentinaArmeniaArubaAustraliaAustriaAzerbaijanBahamas, TheBahrainBangladeshBarbadosBelarusBelgiumBelizeBeninBermudaBhutanBoliviaBosnia and HerzegovinaBotswanaBrazilBritish Virgin IslandsBrunei DarussalamBulgariaBurkina FasoBurundiCabo VerdeCambodiaCameroonCanadaCaribbean small statesCayman IslandsCentral African RepublicCentral Europe and the BalticsChadChannel IslandsChileChinaColombiaComorosCongo, Dem. Rep.Congo, Rep.Costa RicaCote d'IvoireCroatiaCubaCuracaoCyprusCzech RepublicDenmarkDjiboutiDominicaDominican RepublicEarly-demographic dividendEast Asia & PacificEast Asia & Pacific (excluding high income)East Asia & Pacific (IDA & IBRD countries)EcuadorEgypt, Arab Rep.El SalvadorEquatorial GuineaEritreaEstoniaEthiopiaEuro areaEurope & Central AsiaEurope & Central Asia (excluding high income)Europe & Central Asia (IDA & IBRD countries)European UnionFaroe IslandsFijiFinlandFragile and conflict affected situationsFranceFrench PolynesiaGabonGambia, TheGeorgiaGermanyGhanaGibraltarGreeceGreenlandGrenadaGuamGuatemalaGuineaGuinea-BissauGuyanaHaitiHeavily indebted poor countries (HIPC)High incomeHondurasHong Kong SAR, ChinaHungaryIBRD onlyIcelandIDA & IBRD totalIDA blendIDA onlyIDA totalIndiaIndonesiaIran, Islamic Rep.IraqIrelandIsle of ManIsraelItalyJamaicaJapanJordanKazakhstanKenyaKiribatiKorea, Dem. People’s Rep.Korea, Rep.KosovoKuwaitKyrgyz RepublicLao PDRLate-demographic dividendLatin America & Caribbean Latin America & Caribbean (excluding high income)Latin America & the Caribbean (IDA & IBRD countries)LatviaLeast developed countries: UN classificationLebanonLesothoLiberiaLibyaLiechtensteinLithuaniaLow & middle incomeLow incomeLower middle incomeLuxembourgMacao SAR, ChinaMacedonia, FYRMadagascarMalawiMalaysiaMaldivesMaliMaltaMarshall IslandsMauritaniaMauritiusMexicoMicronesia, Fed. Sts.Middle East & North AfricaMiddle East & North Africa (excluding high income)Middle East & North Africa (IDA & IBRD countries)Middle incomeMoldovaMonacoMongoliaMontenegroMoroccoMozambiqueMyanmarNamibiaNauruNepalNetherlandsNew CaledoniaNew ZealandNicaraguaNigerNigeriaNorth AmericaNorthern Mariana IslandsNorwayOECD membersOmanOther small statesPacific island small statesPakistanPalauPanamaPapua New GuineaParaguayPeruPhilippinesPolandPortugalPost-demographic dividendPre-demographic dividendPuerto RicoQatarRomaniaRussian FederationRwandaSamoaSan MarinoSao Tome and PrincipeSaudi ArabiaSenegalSerbiaSeychellesSierra LeoneSingaporeSint Maarten (Dutch part)Slovak RepublicSloveniaSmall statesSolomon IslandsSomaliaSouth AfricaSouth AsiaSouth Asia (IDA & IBRD)South SudanSpainSri LankaSt. Kitts and NevisSt. LuciaSt. Martin (French part)St. Vincent and the GrenadinesSub-Saharan Africa Sub-Saharan Africa (excluding high income)Sub-Saharan Africa (IDA & IBRD countries)SudanSurinameSwazilandSwedenSwitzerlandSyrian Arab RepublicTajikistanTanzaniaThailandTimor-LesteTogoTongaTrinidad and TobagoTunisiaTurkeyTurkmenistanTurks and Caicos IslandsTuvaluUgandaUkraineUnited Arab EmiratesUnited KingdomUnited StatesUpper middle incomeUruguayUzbekistanVanuatuVenezuela, RBVietnamVirgin Islands (U.S.)West Bank and GazaWorldYemen, Rep.ZambiaZimbabwe La ligne de temps
Cette échelle de temps montre un graphique de 1961 année à 2016 année Middle income. Les données jusqu'à 1960 année ne sont pas présentés. Quantité d'observations actuelles selon dates: 56.
Source (désignation):
Les indicateurs du développement mondiale
Source (organisation):
(1) United Nations Population Division. World Population Prospects, (2) Census reports and other statistical publications from national statistical offices, (3) Eurostat: Demographic Statistics, (4) United Nations Statistical Division. Population and Vital Statistics Report (various years), (5) U.S. Census Bureau: International Database, and (6) Secretariat of the Pacific Community: Statistics and Demography Programme.
Catégories:
Climate Change, Health
Dernière mise à jour
23 avr. 2017
Les indicateurs de changement de valeurs selon les années
Minimum:
2.122 mds
1 janv. 1961
Maximum:
5.521 mds
1 janv. 2016
Pour la date d''observation
Valeur
Changement absolu
Le changement par rapport à la valeur précédente
1 janv. 1961
2.122 mds
+2.122 mds
0.0%
1 janv. 1962
2.148 mds
+26.289 mln.
1.24%
1 janv. 1963
2.187 mds
+39.436 mln.
1.84%
1 janv. 1964
2.239 mds
+51.342 mln.
2.35%
1 janv. 1965
2.291 mds
+51.798 mln.
2.31%
1 janv. 1966
2.344 mds
+53.269 mln.
2.33%
1 janv. 1967
2.401 mds
+56.788 mln.
2.42%
1 janv. 1968
2.457 mds
+56.587 mln.
2.36%
1 janv. 1969
2.515 mds
+58.17 mln.
2.37%
1 janv. 1970
2.576 mds
+60.503 mln.
2.41%
1 janv. 1971
2.638 mds
+62.046 mln.
2.41%
1 janv. 1972
2.701 mds
+63.543 mln.
2.41%
1 janv. 1973
2.764 mds
+62.752 mln.
2.32%
1 janv. 1974
2.827 mds
+62.572 mln.
2.26%
1 janv. 1975
2.889 mds
+62.023 mln.
2.19%
1 janv. 1976
2.95 mds
+60.69 mln.
2.1%
1 janv. 1977
3.01 mds
+60.052 mln.
2.04%
1 janv. 1978
3.069 mds
+59.433 mln.
1.97%
1 janv. 1979
3.129 mds
+60.448 mln.
1.97%
1 janv. 1980
3.191 mds
+61.872 mln.
1.98%
1 janv. 1981
3.254 mds
+62.726 mln.
1.97%
1 janv. 1982
3.318 mds
+64.328 mln.
1.98%
1 janv. 1983
3.386 mds
+67.615 mln.
2.04%
1 janv. 1984
3.455 mds
+68.571 mln.
2.03%
1 janv. 1985
3.523 mds
+68.41 mln.
1.98%
1 janv. 1986
3.593 mds
+69.806 mln.
1.98%
1 janv. 1987
3.665 mds
+71.91 mln.
2.0%
1 janv. 1988
3.738 mds
+73.794 mln.
2.01%
1 janv. 1989
3.813 mds
+74.153 mln.
1.98%
1 janv. 1990
3.886 mds
+73.29 mln.
1.92%
1 janv. 1991
3.959 mds
+73.45 mln.
1.89%
1 janv. 1992
4.029 mds
+69.788 mln.
1.76%
1 janv. 1993
4.097 mds
+67.773 mln.
1.68%
1 janv. 1994
4.163 mds
+66.479 mln.
1.62%
1 janv. 1995
4.229 mds
+66.014 mln.
1.59%
1 janv. 1996
4.295 mds
+65.646 mln.
1.55%
1 janv. 1997
4.361 mds
+65.515 mln.
1.53%
1 janv. 1998
4.426 mds
+65.546 mln.
1.5%
1 janv. 1999
4.491 mds
+64.835 mln.
1.46%
1 janv. 2000
4.554 mds
+63.485 mln.
1.41%
1 janv. 2001
4.617 mds
+62.468 mln.
1.37%
1 janv. 2002
4.678 mds
+60.984 mln.
1.32%
1 janv. 2003
4.738 mds
+59.649 mln.
1.28%
1 janv. 2004
4.797 mds
+59.472 mln.
1.26%
1 janv. 2005
4.856 mds
+59.31 mln.
1.24%
1 janv. 2006
4.916 mds
+59.286 mln.
1.22%
1 janv. 2007
4.975 mds
+59.008 mln.
1.2%
1 janv. 2008
5.033 mds
+58.563 mln.
1.18%
1 janv. 2009
5.092 mds
+59.027 mln.
1.17%
1 janv. 2010
5.152 mds
+59.801 mln.
1.17%
1 janv. 2011
5.212 mds
+60.27 mln.
1.17%
1 janv. 2012
5.273 mds
+60.908 mln.
1.17%
1 janv. 2013
5.335 mds
+61.372 mln.
1.16%
1 janv. 2014
5.397 mds
+61.955 mln.
1.16%
1 janv. 2015
5.459 mds
+62.345 mln.
1.16%
1 janv. 2016
5.521 mds
+62.296 mln.
1.14%
Classement des pays selon les statistiques actuelles par années


Commentaires: