29
/fr/
fr
AIzaSyAYiBZKx7MnpbEhh9jyipgxe19OcubqV5w
April 1, 2024
39382
IDA only
IDX
false
2
1
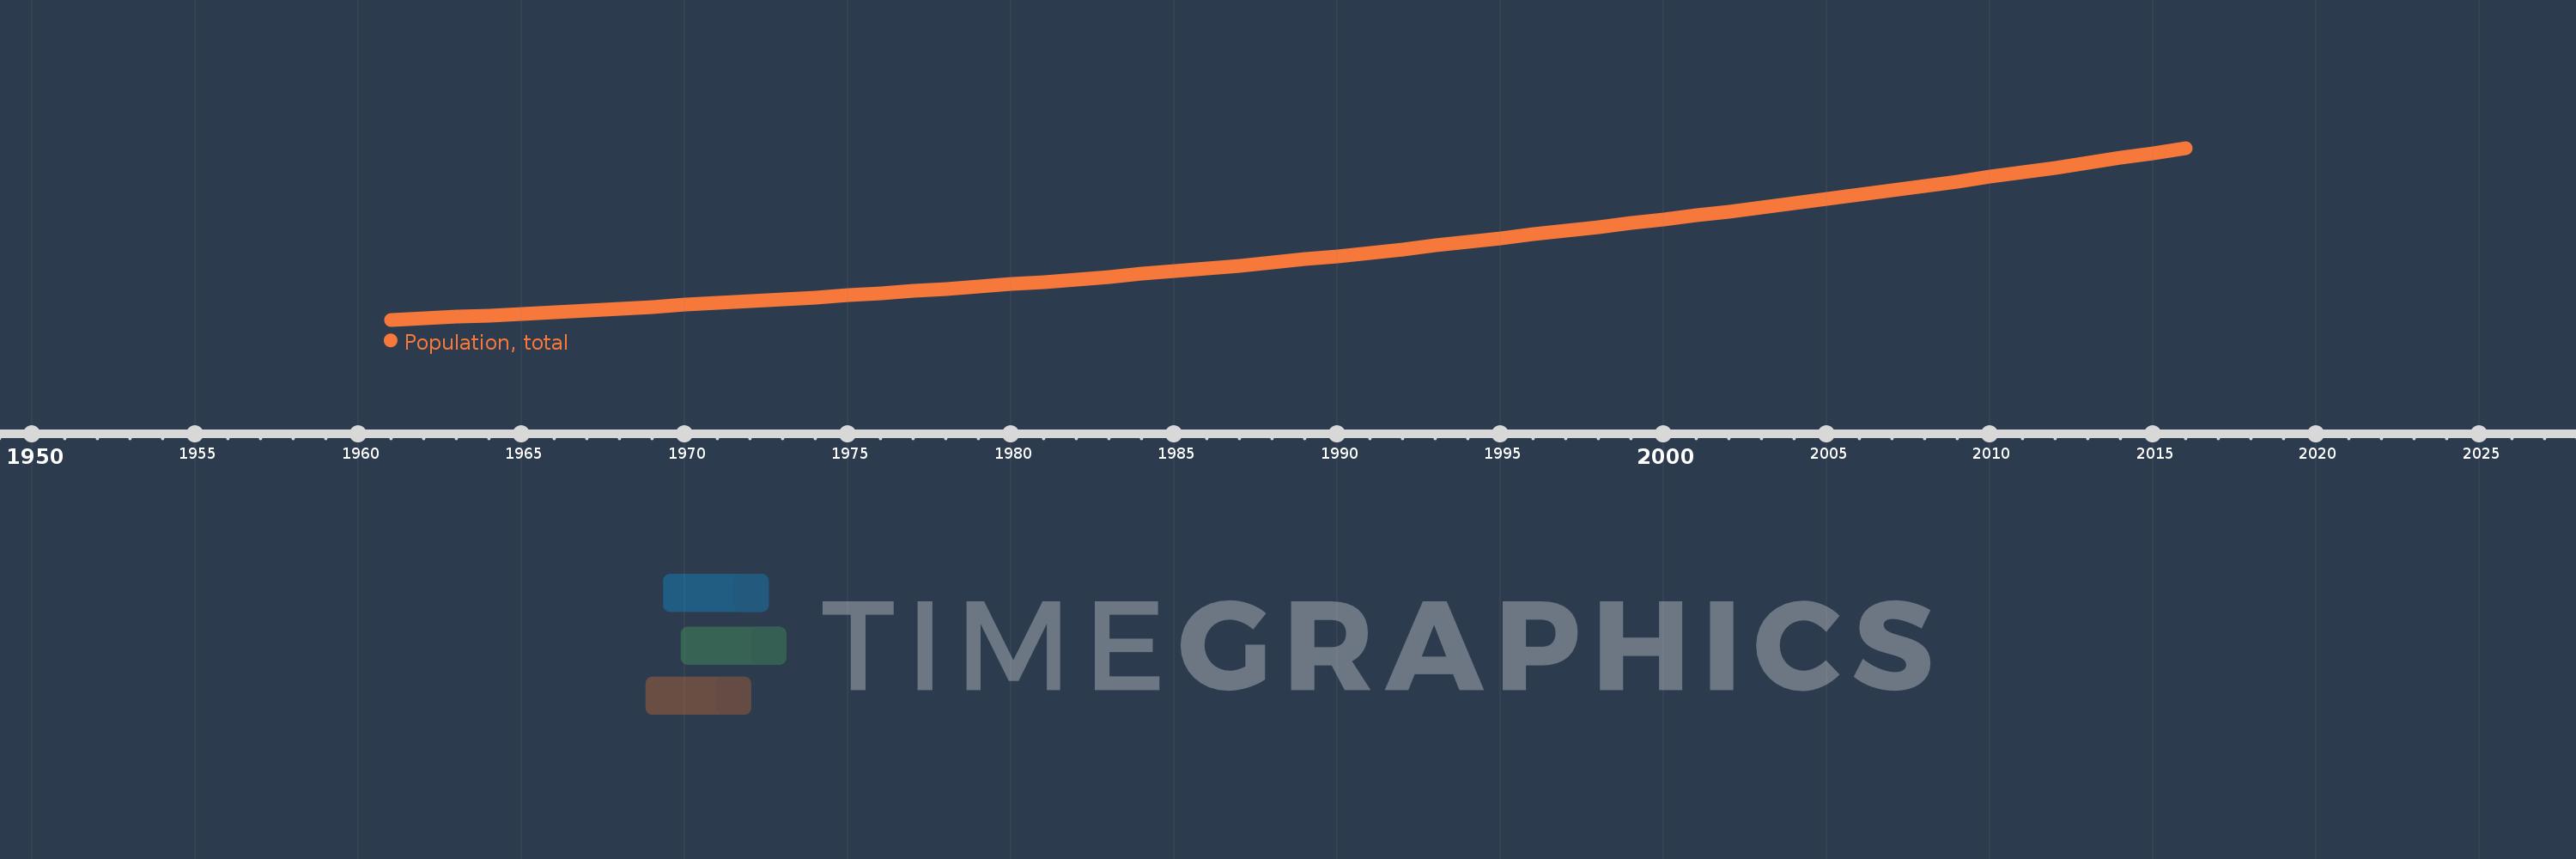
Population, total
2016,2015,2014,2013,2012,2011,2010,2009,2008,2007,2006,2005,2004,2003,2002,2001,2000,1999,1998,1997,1996,1995,1994,1993,1992,1991,1990,1989,1988,1987,1986,1985,1984,1983,1982,1981,1980,1979,1978,1977,1976,1975,1974,1973,1972,1971,1970,1969,1968,1967,1966,1965,1964,1963,1962,1961
Cette statistique dans les autres pays:
AfghanistanAlbaniaAlgeriaAmerican SamoaAndorraAngolaAntigua and BarbudaArab WorldArgentinaArmeniaArubaAustraliaAustriaAzerbaijanBahamas, TheBahrainBangladeshBarbadosBelarusBelgiumBelizeBeninBermudaBhutanBoliviaBosnia and HerzegovinaBotswanaBrazilBritish Virgin IslandsBrunei DarussalamBulgariaBurkina FasoBurundiCabo VerdeCambodiaCameroonCanadaCaribbean small statesCayman IslandsCentral African RepublicCentral Europe and the BalticsChadChannel IslandsChileChinaColombiaComorosCongo, Dem. Rep.Congo, Rep.Costa RicaCote d'IvoireCroatiaCubaCuracaoCyprusCzech RepublicDenmarkDjiboutiDominicaDominican RepublicEarly-demographic dividendEast Asia & PacificEast Asia & Pacific (excluding high income)East Asia & Pacific (IDA & IBRD countries)EcuadorEgypt, Arab Rep.El SalvadorEquatorial GuineaEritreaEstoniaEthiopiaEuro areaEurope & Central AsiaEurope & Central Asia (excluding high income)Europe & Central Asia (IDA & IBRD countries)European UnionFaroe IslandsFijiFinlandFragile and conflict affected situationsFranceFrench PolynesiaGabonGambia, TheGeorgiaGermanyGhanaGibraltarGreeceGreenlandGrenadaGuamGuatemalaGuineaGuinea-BissauGuyanaHaitiHeavily indebted poor countries (HIPC)High incomeHondurasHong Kong SAR, ChinaHungaryIBRD onlyIcelandIDA & IBRD totalIDA blendIDA onlyIDA totalIndiaIndonesiaIran, Islamic Rep.IraqIrelandIsle of ManIsraelItalyJamaicaJapanJordanKazakhstanKenyaKiribatiKorea, Dem. People’s Rep.Korea, Rep.KosovoKuwaitKyrgyz RepublicLao PDRLate-demographic dividendLatin America & Caribbean Latin America & Caribbean (excluding high income)Latin America & the Caribbean (IDA & IBRD countries)LatviaLeast developed countries: UN classificationLebanonLesothoLiberiaLibyaLiechtensteinLithuaniaLow & middle incomeLow incomeLower middle incomeLuxembourgMacao SAR, ChinaMacedonia, FYRMadagascarMalawiMalaysiaMaldivesMaliMaltaMarshall IslandsMauritaniaMauritiusMexicoMicronesia, Fed. Sts.Middle East & North AfricaMiddle East & North Africa (excluding high income)Middle East & North Africa (IDA & IBRD countries)Middle incomeMoldovaMonacoMongoliaMontenegroMoroccoMozambiqueMyanmarNamibiaNauruNepalNetherlandsNew CaledoniaNew ZealandNicaraguaNigerNigeriaNorth AmericaNorthern Mariana IslandsNorwayOECD membersOmanOther small statesPacific island small statesPakistanPalauPanamaPapua New GuineaParaguayPeruPhilippinesPolandPortugalPost-demographic dividendPre-demographic dividendPuerto RicoQatarRomaniaRussian FederationRwandaSamoaSan MarinoSao Tome and PrincipeSaudi ArabiaSenegalSerbiaSeychellesSierra LeoneSingaporeSint Maarten (Dutch part)Slovak RepublicSloveniaSmall statesSolomon IslandsSomaliaSouth AfricaSouth AsiaSouth Asia (IDA & IBRD)South SudanSpainSri LankaSt. Kitts and NevisSt. LuciaSt. Martin (French part)St. Vincent and the GrenadinesSub-Saharan Africa Sub-Saharan Africa (excluding high income)Sub-Saharan Africa (IDA & IBRD countries)SudanSurinameSwazilandSwedenSwitzerlandSyrian Arab RepublicTajikistanTanzaniaThailandTimor-LesteTogoTongaTrinidad and TobagoTunisiaTurkeyTurkmenistanTurks and Caicos IslandsTuvaluUgandaUkraineUnited Arab EmiratesUnited KingdomUnited StatesUpper middle incomeUruguayUzbekistanVanuatuVenezuela, RBVietnamVirgin Islands (U.S.)West Bank and GazaWorldYemen, Rep.ZambiaZimbabwe La ligne de temps
Cette échelle de temps montre un graphique de 1961 année à 2016 année IDA only. Les données jusqu'à 1960 année ne sont pas présentés. Quantité d'observations actuelles selon dates: 56.
Source (désignation):
Les indicateurs du développement mondiale
Source (organisation):
(1) United Nations Population Division. World Population Prospects, (2) Census reports and other statistical publications from national statistical offices, (3) Eurostat: Demographic Statistics, (4) United Nations Statistical Division. Population and Vital Statistics Report (various years), (5) U.S. Census Bureau: International Database, and (6) Secretariat of the Pacific Community: Statistics and Demography Programme.
Catégories:
Climate Change, Health
Dernière mise à jour
23 avr. 2017
Les indicateurs de changement de valeurs selon les années
Minimum:
267.719 mln.
1 janv. 1961
Maximum:
1.074 mds
1 janv. 2016
Pour la date d''observation
Valeur
Changement absolu
Le changement par rapport à la valeur précédente
1 janv. 1961
267.719 mln.
+267.719 mln.
0.0%
1 janv. 1962
274.348 mln.
+6.629 mln.
2.48%
1 janv. 1963
281.215 mln.
+6.866 mln.
2.5%
1 janv. 1964
288.349 mln.
+7.134 mln.
2.54%
1 janv. 1965
295.79 mln.
+7.441 mln.
2.58%
1 janv. 1966
303.556 mln.
+7.766 mln.
2.63%
1 janv. 1967
311.681 mln.
+8.125 mln.
2.68%
1 janv. 1968
320.137 mln.
+8.456 mln.
2.71%
1 janv. 1969
328.831 mln.
+8.694 mln.
2.72%
1 janv. 1970
337.633 mln.
+8.802 mln.
2.68%
1 janv. 1971
346.454 mln.
+8.821 mln.
2.61%
1 janv. 1972
355.269 mln.
+8.815 mln.
2.54%
1 janv. 1973
364.13 mln.
+8.862 mln.
2.49%
1 janv. 1974
373.121 mln.
+8.991 mln.
2.47%
1 janv. 1975
382.379 mln.
+9.258 mln.
2.48%
1 janv. 1976
391.993 mln.
+9.615 mln.
2.51%
1 janv. 1977
402.002 mln.
+10.009 mln.
2.55%
1 janv. 1978
412.39 mln.
+10.388 mln.
2.58%
1 janv. 1979
423.149 mln.
+10.758 mln.
2.61%
1 janv. 1980
434.256 mln.
+11.107 mln.
2.62%
1 janv. 1981
445.692 mln.
+11.437 mln.
2.63%
1 janv. 1982
457.471 mln.
+11.778 mln.
2.64%
1 janv. 1983
469.617 mln.
+12.146 mln.
2.66%
1 janv. 1984
482.159 mln.
+12.542 mln.
2.67%
1 janv. 1985
495.121 mln.
+12.962 mln.
2.69%
1 janv. 1986
508.524 mln.
+13.403 mln.
2.71%
1 janv. 1987
522.363 mln.
+13.84 mln.
2.72%
1 janv. 1988
536.638 mln.
+14.275 mln.
2.73%
1 janv. 1989
551.379 mln.
+14.741 mln.
2.75%
1 janv. 1990
566.648 mln.
+15.269 mln.
2.77%
1 janv. 1991
582.442 mln.
+15.794 mln.
2.79%
1 janv. 1992
598.801 mln.
+16.358 mln.
2.81%
1 janv. 1993
615.659 mln.
+16.858 mln.
2.82%
1 janv. 1994
632.849 mln.
+17.19 mln.
2.79%
1 janv. 1995
650.218 mln.
+17.37 mln.
2.74%
1 janv. 1996
667.696 mln.
+17.477 mln.
2.69%
1 janv. 1997
685.185 mln.
+17.489 mln.
2.62%
1 janv. 1998
702.705 mln.
+17.521 mln.
2.56%
1 janv. 1999
720.229 mln.
+17.523 mln.
2.49%
1 janv. 2000
737.962 mln.
+17.734 mln.
2.46%
1 janv. 2001
756.227 mln.
+18.265 mln.
2.48%
1 janv. 2002
774.979 mln.
+18.752 mln.
2.48%
1 janv. 2003
794.131 mln.
+19.152 mln.
2.47%
1 janv. 2004
813.668 mln.
+19.537 mln.
2.46%
1 janv. 2005
833.545 mln.
+19.877 mln.
2.44%
1 janv. 2006
853.717 mln.
+20.171 mln.
2.42%
1 janv. 2007
874.213 mln.
+20.496 mln.
2.4%
1 janv. 2008
895.041 mln.
+20.828 mln.
2.38%
1 janv. 2009
916.184 mln.
+21.143 mln.
2.36%
1 janv. 2010
937.622 mln.
+21.438 mln.
2.34%
1 janv. 2011
959.361 mln.
+21.738 mln.
2.32%
1 janv. 2012
981.376 mln.
+22.015 mln.
2.29%
1 janv. 2013
1.004 mds
+22.341 mln.
2.28%
1 janv. 2014
1.026 mds
+22.774 mln.
2.27%
1 janv. 2015
1.05 mds
+23.322 mln.
2.27%
1 janv. 2016
1.074 mds
+23.983 mln.
2.28%
Classement des pays selon les statistiques actuelles par années


Commentaires: