29
/fr/
fr
AIzaSyAYiBZKx7MnpbEhh9jyipgxe19OcubqV5w
April 1, 2024
43797
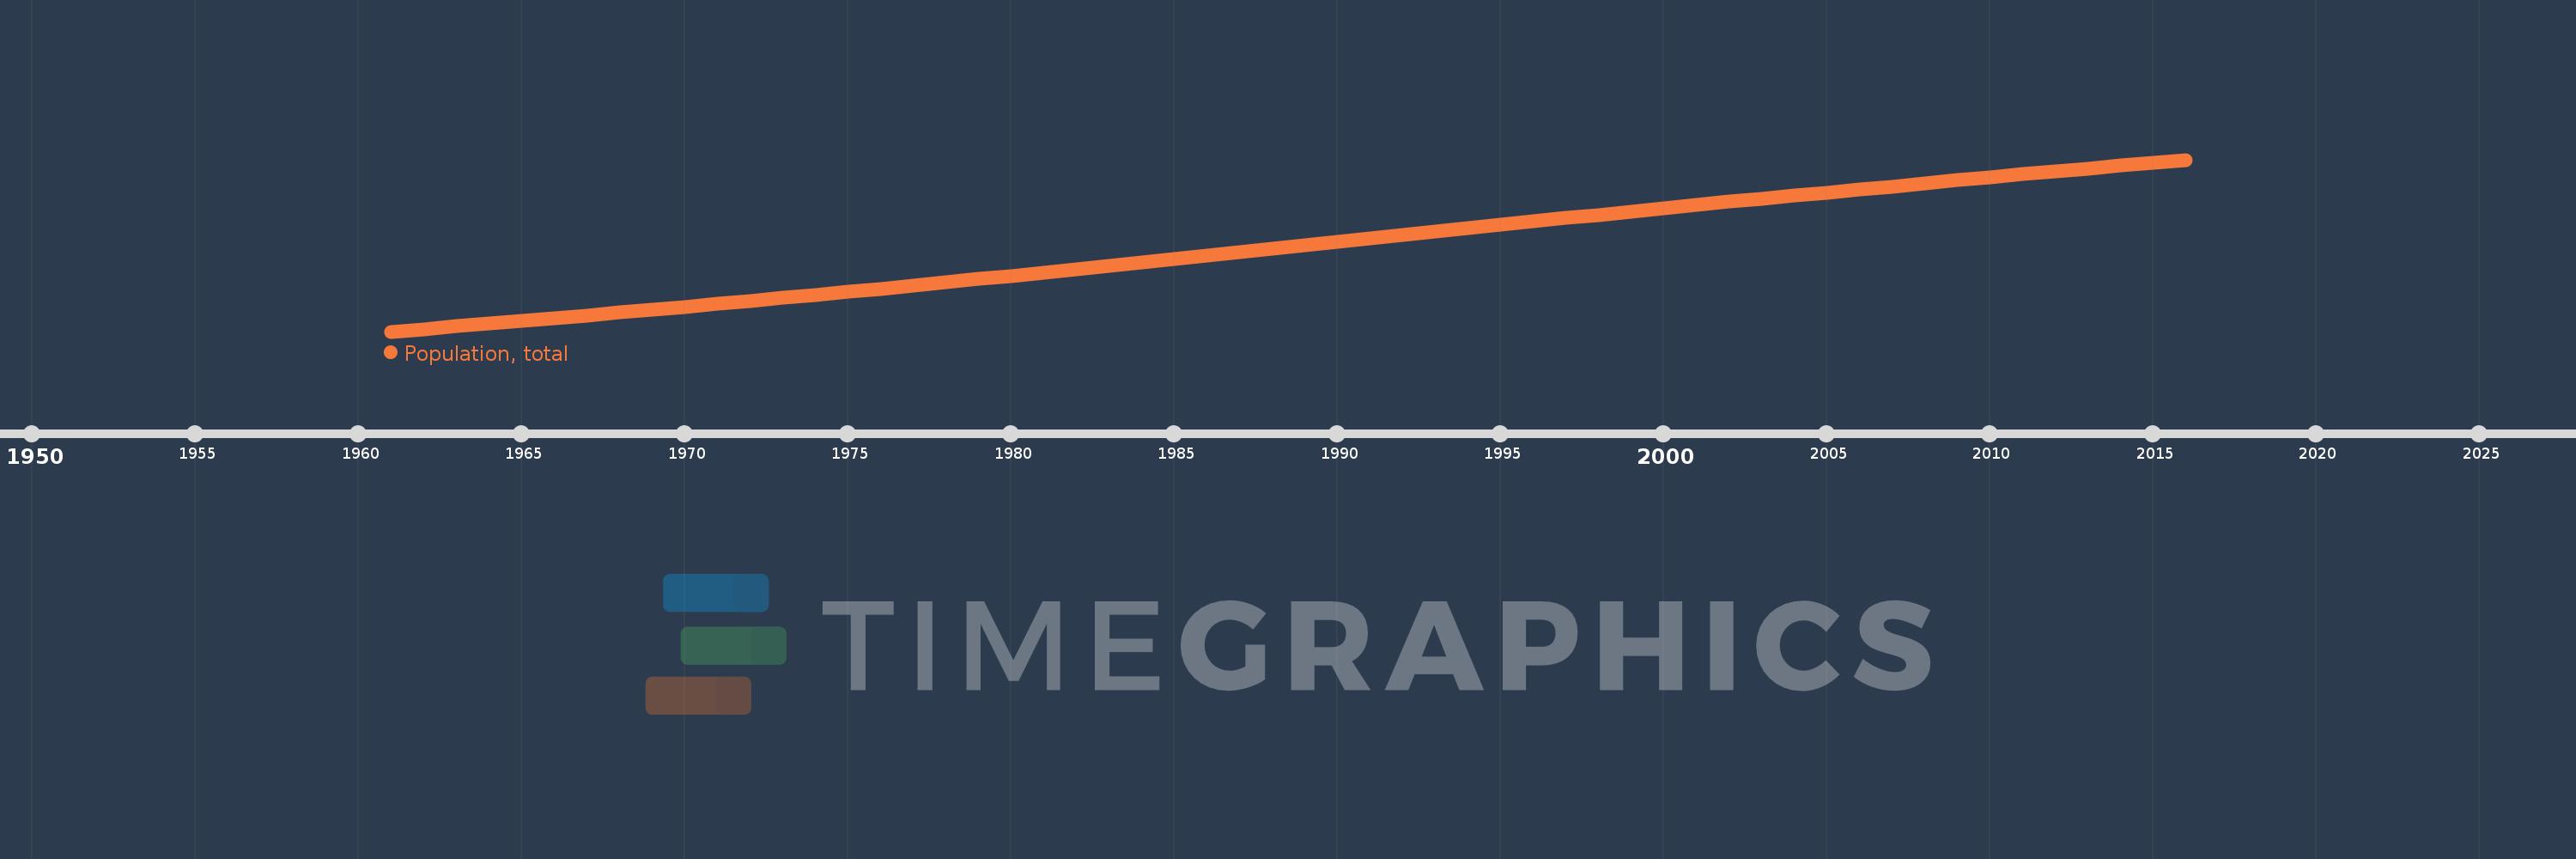
Latin America & the Caribbean (IDA & IBRD countries)
TLA
false
2
1
Population, total
2016,2015,2014,2013,2012,2011,2010,2009,2008,2007,2006,2005,2004,2003,2002,2001,2000,1999,1998,1997,1996,1995,1994,1993,1992,1991,1990,1989,1988,1987,1986,1985,1984,1983,1982,1981,1980,1979,1978,1977,1976,1975,1974,1973,1972,1971,1970,1969,1968,1967,1966,1965,1964,1963,1962,1961
Cette statistique dans les autres pays:
AfghanistanAlbaniaAlgeriaAmerican SamoaAndorraAngolaAntigua and BarbudaArab WorldArgentinaArmeniaArubaAustraliaAustriaAzerbaijanBahamas, TheBahrainBangladeshBarbadosBelarusBelgiumBelizeBeninBermudaBhutanBoliviaBosnia and HerzegovinaBotswanaBrazilBritish Virgin IslandsBrunei DarussalamBulgariaBurkina FasoBurundiCabo VerdeCambodiaCameroonCanadaCaribbean small statesCayman IslandsCentral African RepublicCentral Europe and the BalticsChadChannel IslandsChileChinaColombiaComorosCongo, Dem. Rep.Congo, Rep.Costa RicaCote d'IvoireCroatiaCubaCuracaoCyprusCzech RepublicDenmarkDjiboutiDominicaDominican RepublicEarly-demographic dividendEast Asia & PacificEast Asia & Pacific (excluding high income)East Asia & Pacific (IDA & IBRD countries)EcuadorEgypt, Arab Rep.El SalvadorEquatorial GuineaEritreaEstoniaEthiopiaEuro areaEurope & Central AsiaEurope & Central Asia (excluding high income)Europe & Central Asia (IDA & IBRD countries)European UnionFaroe IslandsFijiFinlandFragile and conflict affected situationsFranceFrench PolynesiaGabonGambia, TheGeorgiaGermanyGhanaGibraltarGreeceGreenlandGrenadaGuamGuatemalaGuineaGuinea-BissauGuyanaHaitiHeavily indebted poor countries (HIPC)High incomeHondurasHong Kong SAR, ChinaHungaryIBRD onlyIcelandIDA & IBRD totalIDA blendIDA onlyIDA totalIndiaIndonesiaIran, Islamic Rep.IraqIrelandIsle of ManIsraelItalyJamaicaJapanJordanKazakhstanKenyaKiribatiKorea, Dem. People’s Rep.Korea, Rep.KosovoKuwaitKyrgyz RepublicLao PDRLate-demographic dividendLatin America & Caribbean Latin America & Caribbean (excluding high income)Latin America & the Caribbean (IDA & IBRD countries)LatviaLeast developed countries: UN classificationLebanonLesothoLiberiaLibyaLiechtensteinLithuaniaLow & middle incomeLow incomeLower middle incomeLuxembourgMacao SAR, ChinaMacedonia, FYRMadagascarMalawiMalaysiaMaldivesMaliMaltaMarshall IslandsMauritaniaMauritiusMexicoMicronesia, Fed. Sts.Middle East & North AfricaMiddle East & North Africa (excluding high income)Middle East & North Africa (IDA & IBRD countries)Middle incomeMoldovaMonacoMongoliaMontenegroMoroccoMozambiqueMyanmarNamibiaNauruNepalNetherlandsNew CaledoniaNew ZealandNicaraguaNigerNigeriaNorth AmericaNorthern Mariana IslandsNorwayOECD membersOmanOther small statesPacific island small statesPakistanPalauPanamaPapua New GuineaParaguayPeruPhilippinesPolandPortugalPost-demographic dividendPre-demographic dividendPuerto RicoQatarRomaniaRussian FederationRwandaSamoaSan MarinoSao Tome and PrincipeSaudi ArabiaSenegalSerbiaSeychellesSierra LeoneSingaporeSint Maarten (Dutch part)Slovak RepublicSloveniaSmall statesSolomon IslandsSomaliaSouth AfricaSouth AsiaSouth Asia (IDA & IBRD)South SudanSpainSri LankaSt. Kitts and NevisSt. LuciaSt. Martin (French part)St. Vincent and the GrenadinesSub-Saharan Africa Sub-Saharan Africa (excluding high income)Sub-Saharan Africa (IDA & IBRD countries)SudanSurinameSwazilandSwedenSwitzerlandSyrian Arab RepublicTajikistanTanzaniaThailandTimor-LesteTogoTongaTrinidad and TobagoTunisiaTurkeyTurkmenistanTurks and Caicos IslandsTuvaluUgandaUkraineUnited Arab EmiratesUnited KingdomUnited StatesUpper middle incomeUruguayUzbekistanVanuatuVenezuela, RBVietnamVirgin Islands (U.S.)West Bank and GazaWorldYemen, Rep.ZambiaZimbabwe La ligne de temps
Cette échelle de temps montre un graphique de 1961 année à 2016 année Latin America & the Caribbean (IDA & IBRD countries). Les données jusqu'à 1960 année ne sont pas présentés. Quantité d'observations actuelles selon dates: 56.
Source (désignation):
Les indicateurs du développement mondiale
Source (organisation):
(1) United Nations Population Division. World Population Prospects, (2) Census reports and other statistical publications from national statistical offices, (3) Eurostat: Demographic Statistics, (4) United Nations Statistical Division. Population and Vital Statistics Report (various years), (5) U.S. Census Bureau: International Database, and (6) Secretariat of the Pacific Community: Statistics and Demography Programme.
Catégories:
Climate Change, Health
Dernière mise à jour
23 avr. 2017
Les indicateurs de changement de valeurs selon les années
Minimum:
210.496 mln.
1 janv. 1961
Maximum:
616.863 mln.
1 janv. 2016
Pour la date d''observation
Valeur
Changement absolu
Le changement par rapport à la valeur précédente
1 janv. 1961
210.496 mln.
+210.496 mln.
0.0%
1 janv. 1962
216.494 mln.
+5.998 mln.
2.85%
1 janv. 1963
222.689 mln.
+6.195 mln.
2.86%
1 janv. 1964
229.042 mln.
+6.353 mln.
2.85%
1 janv. 1965
235.499 mln.
+6.456 mln.
2.82%
1 janv. 1966
242.018 mln.
+6.52 mln.
2.77%
1 janv. 1967
248.587 mln.
+6.568 mln.
2.71%
1 janv. 1968
255.212 mln.
+6.625 mln.
2.67%
1 janv. 1969
261.911 mln.
+6.699 mln.
2.62%
1 janv. 1970
268.712 mln.
+6.801 mln.
2.6%
1 janv. 1971
275.635 mln.
+6.923 mln.
2.58%
1 janv. 1972
282.681 mln.
+7.046 mln.
2.56%
1 janv. 1973
289.842 mln.
+7.16 mln.
2.53%
1 janv. 1974
297.109 mln.
+7.267 mln.
2.51%
1 janv. 1975
304.472 mln.
+7.364 mln.
2.48%
1 janv. 1976
311.924 mln.
+7.451 mln.
2.45%
1 janv. 1977
319.457 mln.
+7.533 mln.
2.42%
1 janv. 1978
327.07 mln.
+7.613 mln.
2.38%
1 janv. 1979
334.766 mln.
+7.696 mln.
2.35%
1 janv. 1980
342.552 mln.
+7.786 mln.
2.33%
1 janv. 1981
350.431 mln.
+7.879 mln.
2.3%
1 janv. 1982
358.395 mln.
+7.965 mln.
2.27%
1 janv. 1983
366.442 mln.
+8.047 mln.
2.25%
1 janv. 1984
374.542 mln.
+8.1 mln.
2.21%
1 janv. 1985
382.66 mln.
+8.118 mln.
2.17%
1 janv. 1986
390.766 mln.
+8.106 mln.
2.12%
1 janv. 1987
398.849 mln.
+8.083 mln.
2.07%
1 janv. 1988
406.906 mln.
+8.057 mln.
2.02%
1 janv. 1989
414.936 mln.
+8.031 mln.
1.97%
1 janv. 1990
422.967 mln.
+8.031 mln.
1.94%
1 janv. 1991
430.984 mln.
+8.017 mln.
1.9%
1 janv. 1992
438.984 mln.
+8.0 mln.
1.86%
1 janv. 1993
446.961 mln.
+7.976 mln.
1.82%
1 janv. 1994
454.917 mln.
+7.957 mln.
1.78%
1 janv. 1995
462.862 mln.
+7.944 mln.
1.75%
1 janv. 1996
470.796 mln.
+7.935 mln.
1.71%
1 janv. 1997
478.735 mln.
+7.939 mln.
1.69%
1 janv. 1998
486.652 mln.
+7.917 mln.
1.65%
1 janv. 1999
494.519 mln.
+7.867 mln.
1.62%
1 janv. 2000
502.29 mln.
+7.771 mln.
1.57%
1 janv. 2001
509.939 mln.
+7.649 mln.
1.52%
1 janv. 2002
517.453 mln.
+7.514 mln.
1.47%
1 janv. 2003
524.837 mln.
+7.384 mln.
1.43%
1 janv. 2004
532.129 mln.
+7.292 mln.
1.39%
1 janv. 2005
539.376 mln.
+7.247 mln.
1.36%
1 janv. 2006
546.612 mln.
+7.236 mln.
1.34%
1 janv. 2007
553.845 mln.
+7.233 mln.
1.32%
1 janv. 2008
561.062 mln.
+7.217 mln.
1.3%
1 janv. 2009
568.252 mln.
+7.191 mln.
1.28%
1 janv. 2010
575.398 mln.
+7.146 mln.
1.26%
1 janv. 2011
582.484 mln.
+7.086 mln.
1.23%
1 janv. 2012
589.506 mln.
+7.022 mln.
1.21%
1 janv. 2013
596.463 mln.
+6.957 mln.
1.18%
1 janv. 2014
603.348 mln.
+6.884 mln.
1.15%
1 janv. 2015
610.15 mln.
+6.802 mln.
1.13%
1 janv. 2016
616.863 mln.
+6.713 mln.
1.1%
Classement des pays selon les statistiques actuelles par années


Commentaires: