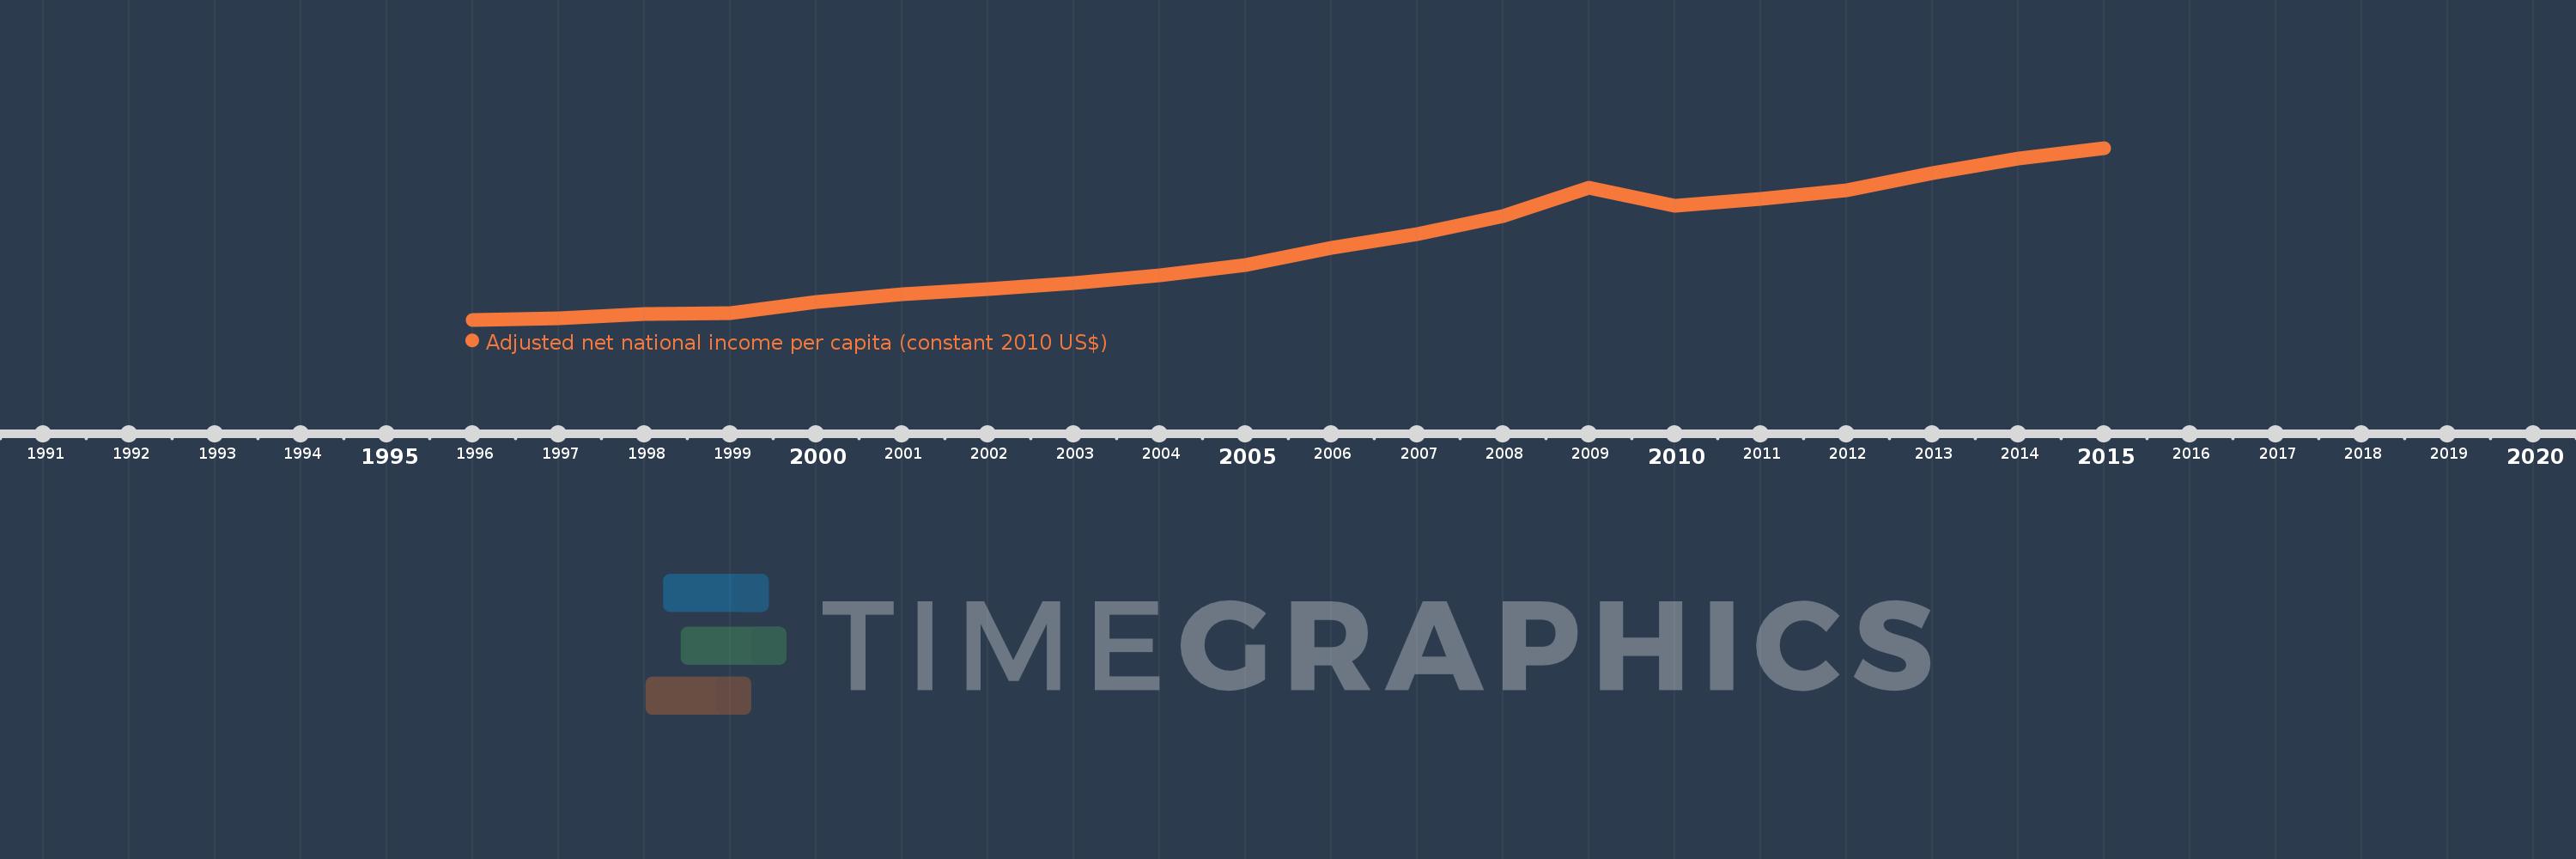
This timeline shows a graph from 1996 to 2015 of Cambodia. No data until 1995. Number of actual observations by date: 20.
Source name:
World Development Indicators
Source organization:
NULWorld Bank staff estimates based on sources and methods in World Bank's "The Changing Wealth of Nations: Measuring Sustainable Development in the New Millennium" (2011).L
Categories, topics:
Economy & Growth
Last updated:
apr 23, 2017
Indicators value changes by year
Meaning:
503.809
Minimum:
267.54
jan 1, 1996
Maximum:
822.686
jan 1, 2015
At the date of observation
Value
Absolute change
Change from the previous value
jan 1, 1996
267.54
+267.54
0.0%
jan 1, 1997
271.405
+3.865
1.44%
jan 1, 1998
286.397
+14.992
5.52%
jan 1, 1999
288.282
+1.885
0.66%
jan 1, 2000
324.577
+36.295
12.59%
jan 1, 2001
348.635
+24.059
7.41%
jan 1, 2002
367.9
+19.265
5.53%
jan 1, 2003
387.239
+19.339
5.26%
jan 1, 2004
412.041
+24.801
6.4%
jan 1, 2005
445.302
+33.261
8.07%
jan 1, 2006
500.91
+55.608
12.49%
jan 1, 2007
545.358
+44.448
8.87%
jan 1, 2008
602.697
+57.339
10.51%
jan 1, 2009
694.23
+91.533
15.19%
jan 1, 2010
637.05
-57.18
-8.24%
jan 1, 2011
657.796
+20.746
3.26%
jan 1, 2012
685.312
+27.516
4.18%
jan 1, 2013
741.397
+56.085
8.18%
jan 1, 2014
789.418
+48.022
6.48%
jan 1, 2015
822.686
+33.268
4.21%
Ranking of countries by current statistics by years