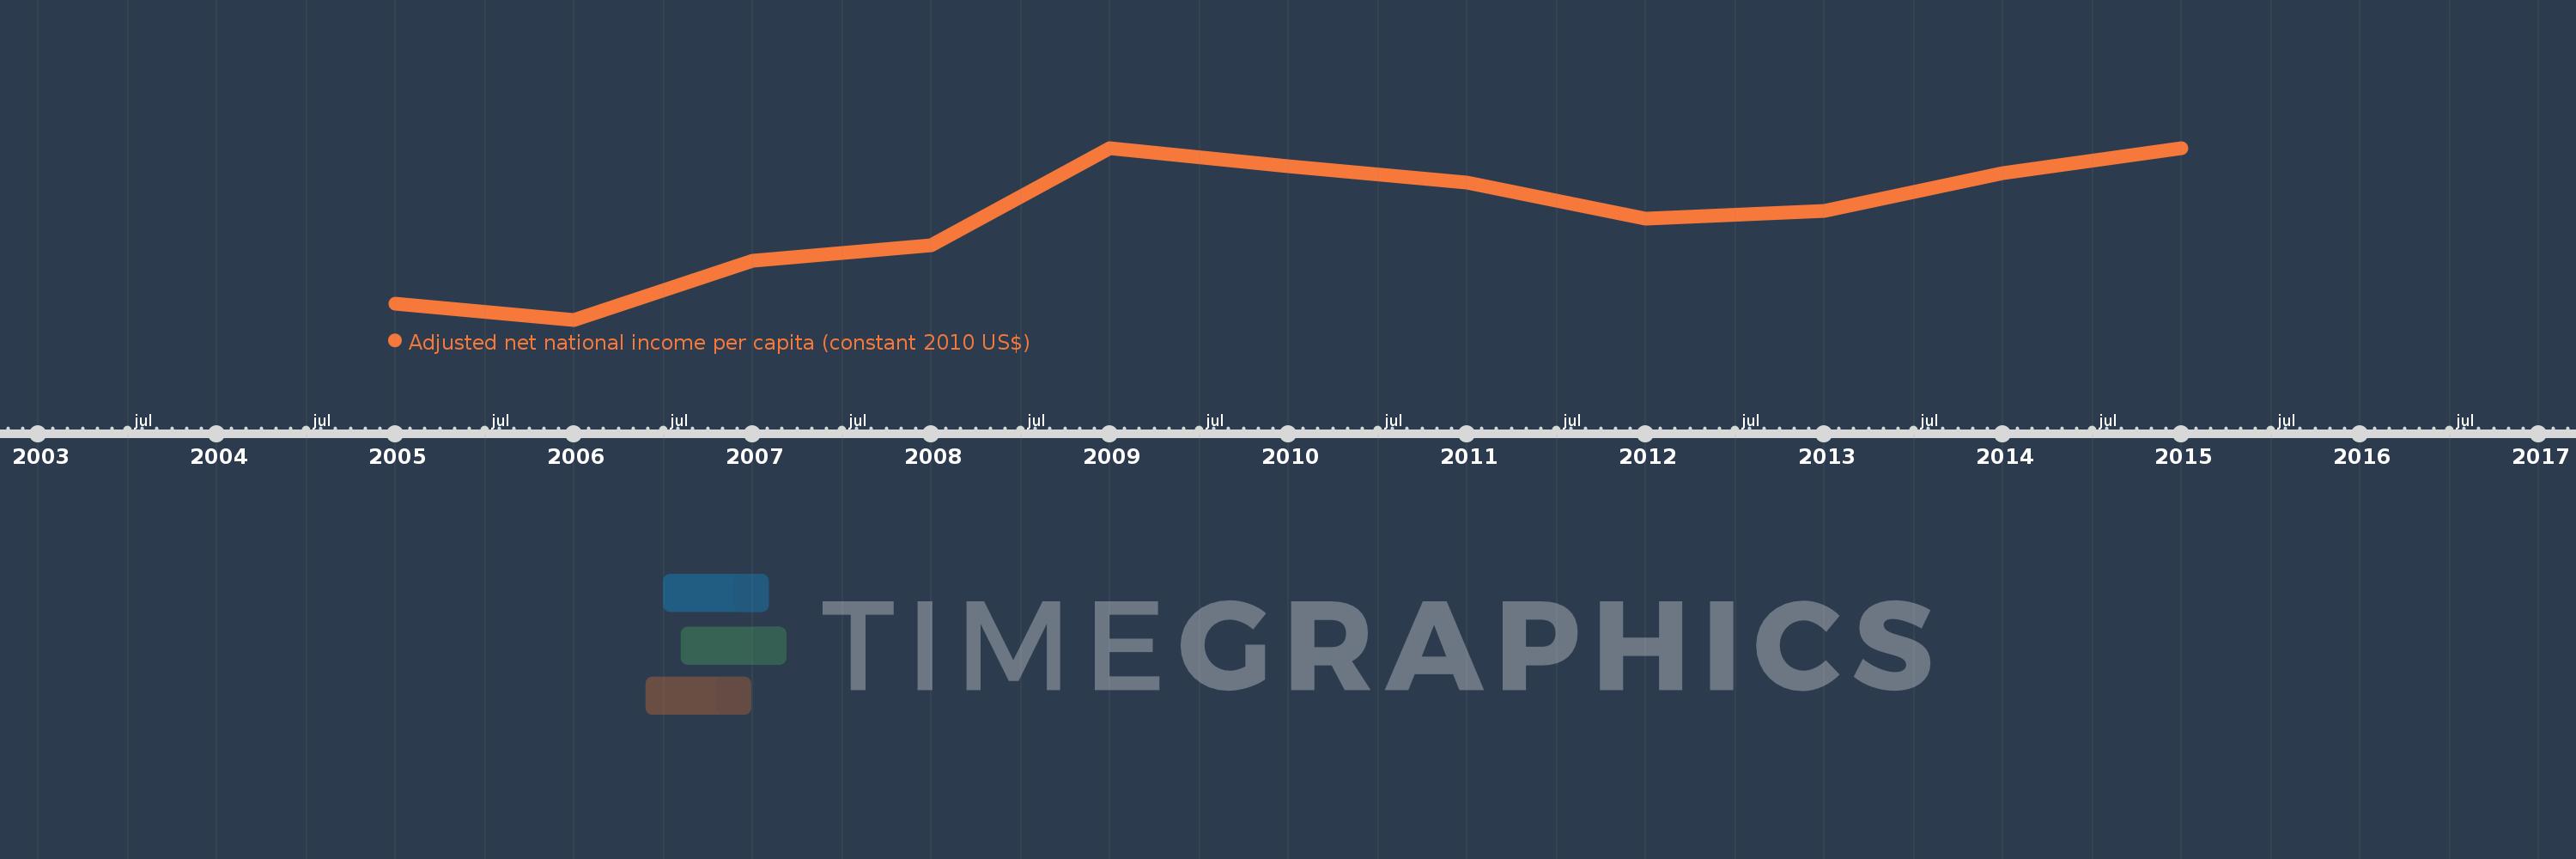
This timeline shows a graph from 2005 to 2015 of Vanuatu. No data until 2004. Number of actual observations by date: 11.
Source name:
World Development Indicators
Source organization:
NULWorld Bank staff estimates based on sources and methods in World Bank's "The Changing Wealth of Nations: Measuring Sustainable Development in the New Millennium" (2011).L
Categories, topics:
Economy & Growth
Last updated:
apr 23, 2017
Indicators value changes by year
Meaning:
2.456K
Minimum:
2.073K
jan 1, 2006
Maximum:
2.707K
jan 1, 2015
At the date of observation
Value
Absolute change
Change from the previous value
jan 1, 2005
2.133K
+2.133K
0.0%
jan 1, 2006
2.073K
-59.499
-2.79%
jan 1, 2007
2.29K
+216.514
10.44%
jan 1, 2008
2.347K
+56.879
2.48%
jan 1, 2009
2.705K
+358.61
15.28%
jan 1, 2010
2.641K
-64.216
-2.37%
jan 1, 2011
2.579K
-62.159
-2.35%
jan 1, 2012
2.448K
-131.421
-5.1%
jan 1, 2013
2.475K
+27.786
1.14%
jan 1, 2014
2.616K
+140.539
5.68%
jan 1, 2015
2.707K
+91.407
3.49%
Ranking of countries by current statistics by years