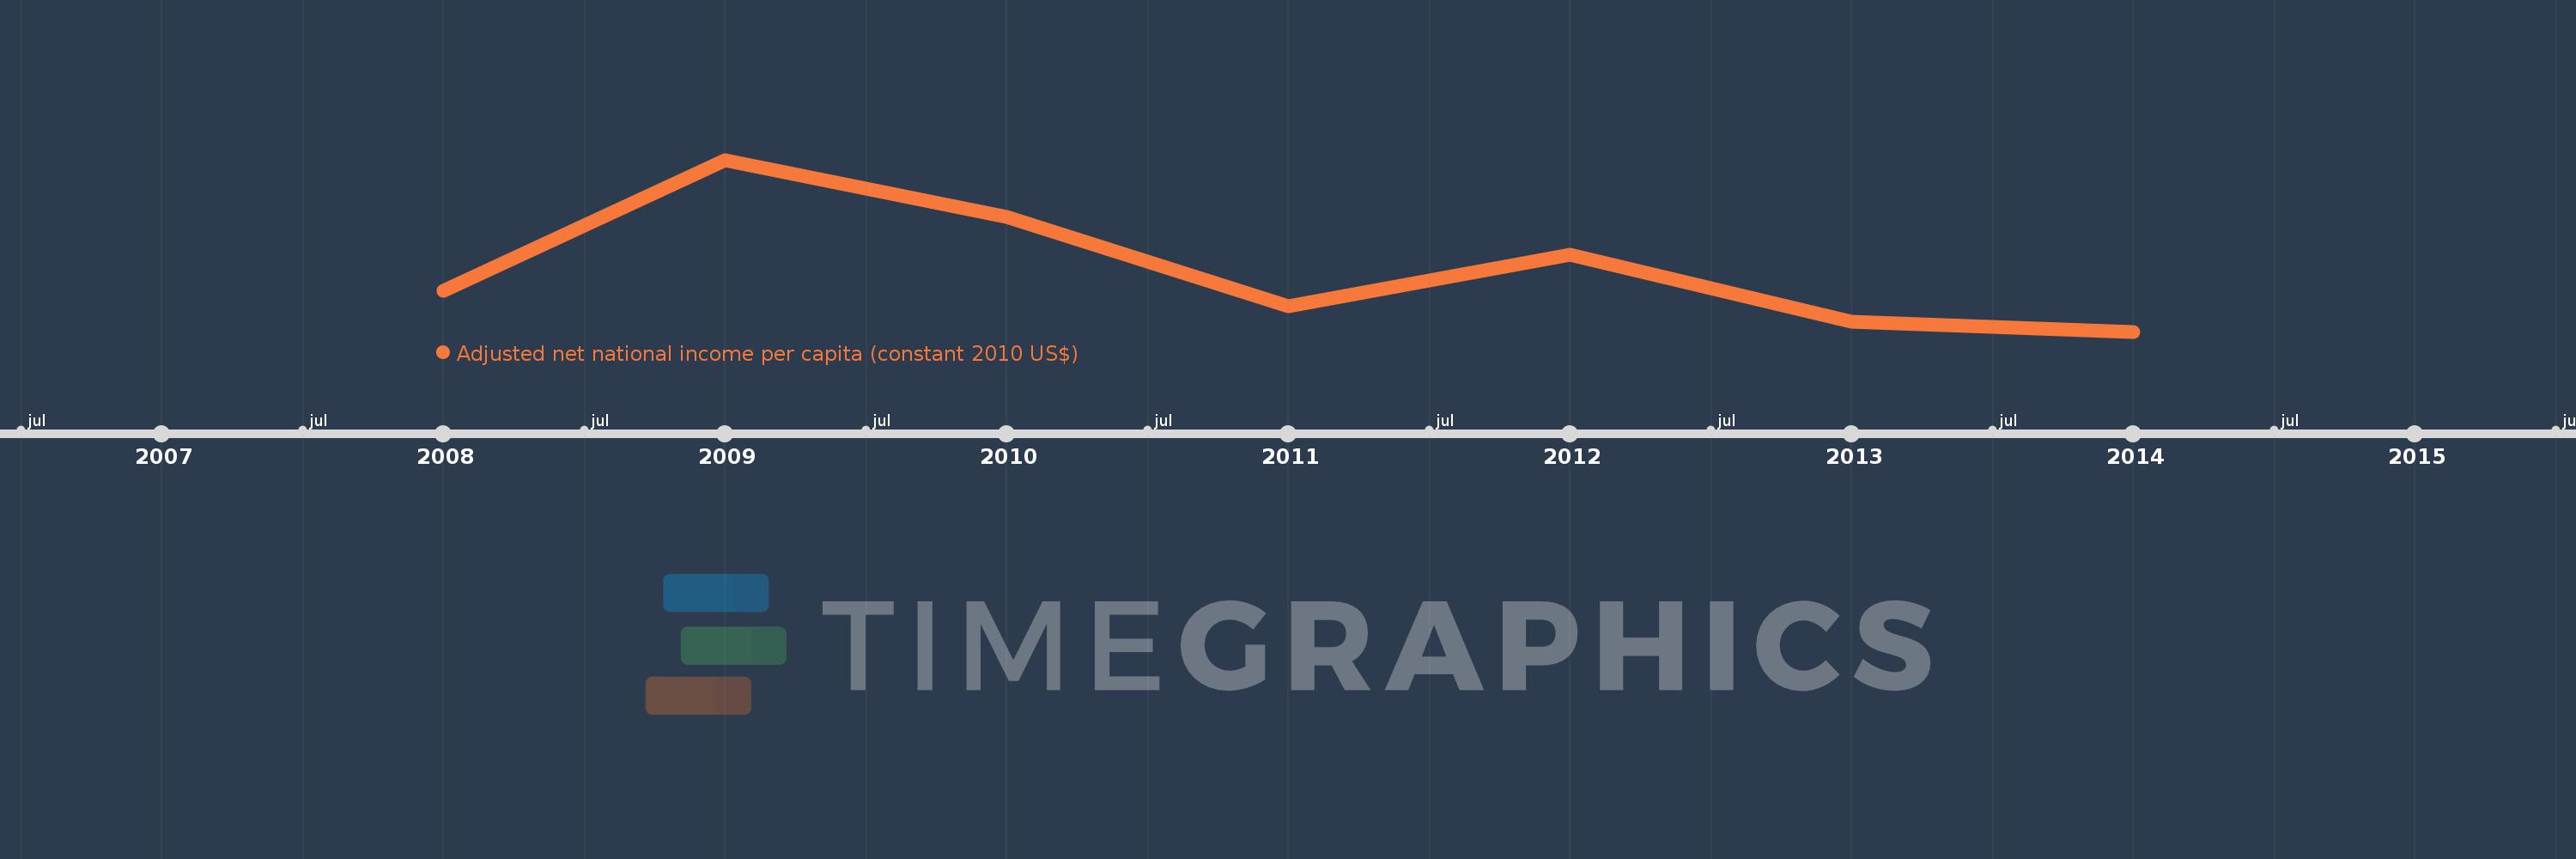
This timeline shows a graph from 2008 to 2014 of Cabo Verde. No data until 2007. Number of actual observations by date: 7.
Source name:
World Development Indicators
Source organization:
NULWorld Bank staff estimates based on sources and methods in World Bank's "The Changing Wealth of Nations: Measuring Sustainable Development in the New Millennium" (2011).L
Categories, topics:
Economy & Growth
Last updated:
apr 23, 2017
Indicators value changes by year
Meaning:
2.658K
Minimum:
2.61K
jan 1, 2014
Maximum:
2.741K
jan 1, 2009
At the date of observation
Value
Absolute change
Change from the previous value
jan 1, 2008
2.641K
+2.641K
0.0%
jan 1, 2009
2.741K
+99.536
3.77%
jan 1, 2010
2.697K
-43.606
-1.59%
jan 1, 2011
2.63K
-67.493
-2.5%
jan 1, 2012
2.669K
+39.007
1.48%
jan 1, 2013
2.618K
-50.868
-1.91%
jan 1, 2014
2.61K
-7.485
-0.29%
Ranking of countries by current statistics by years