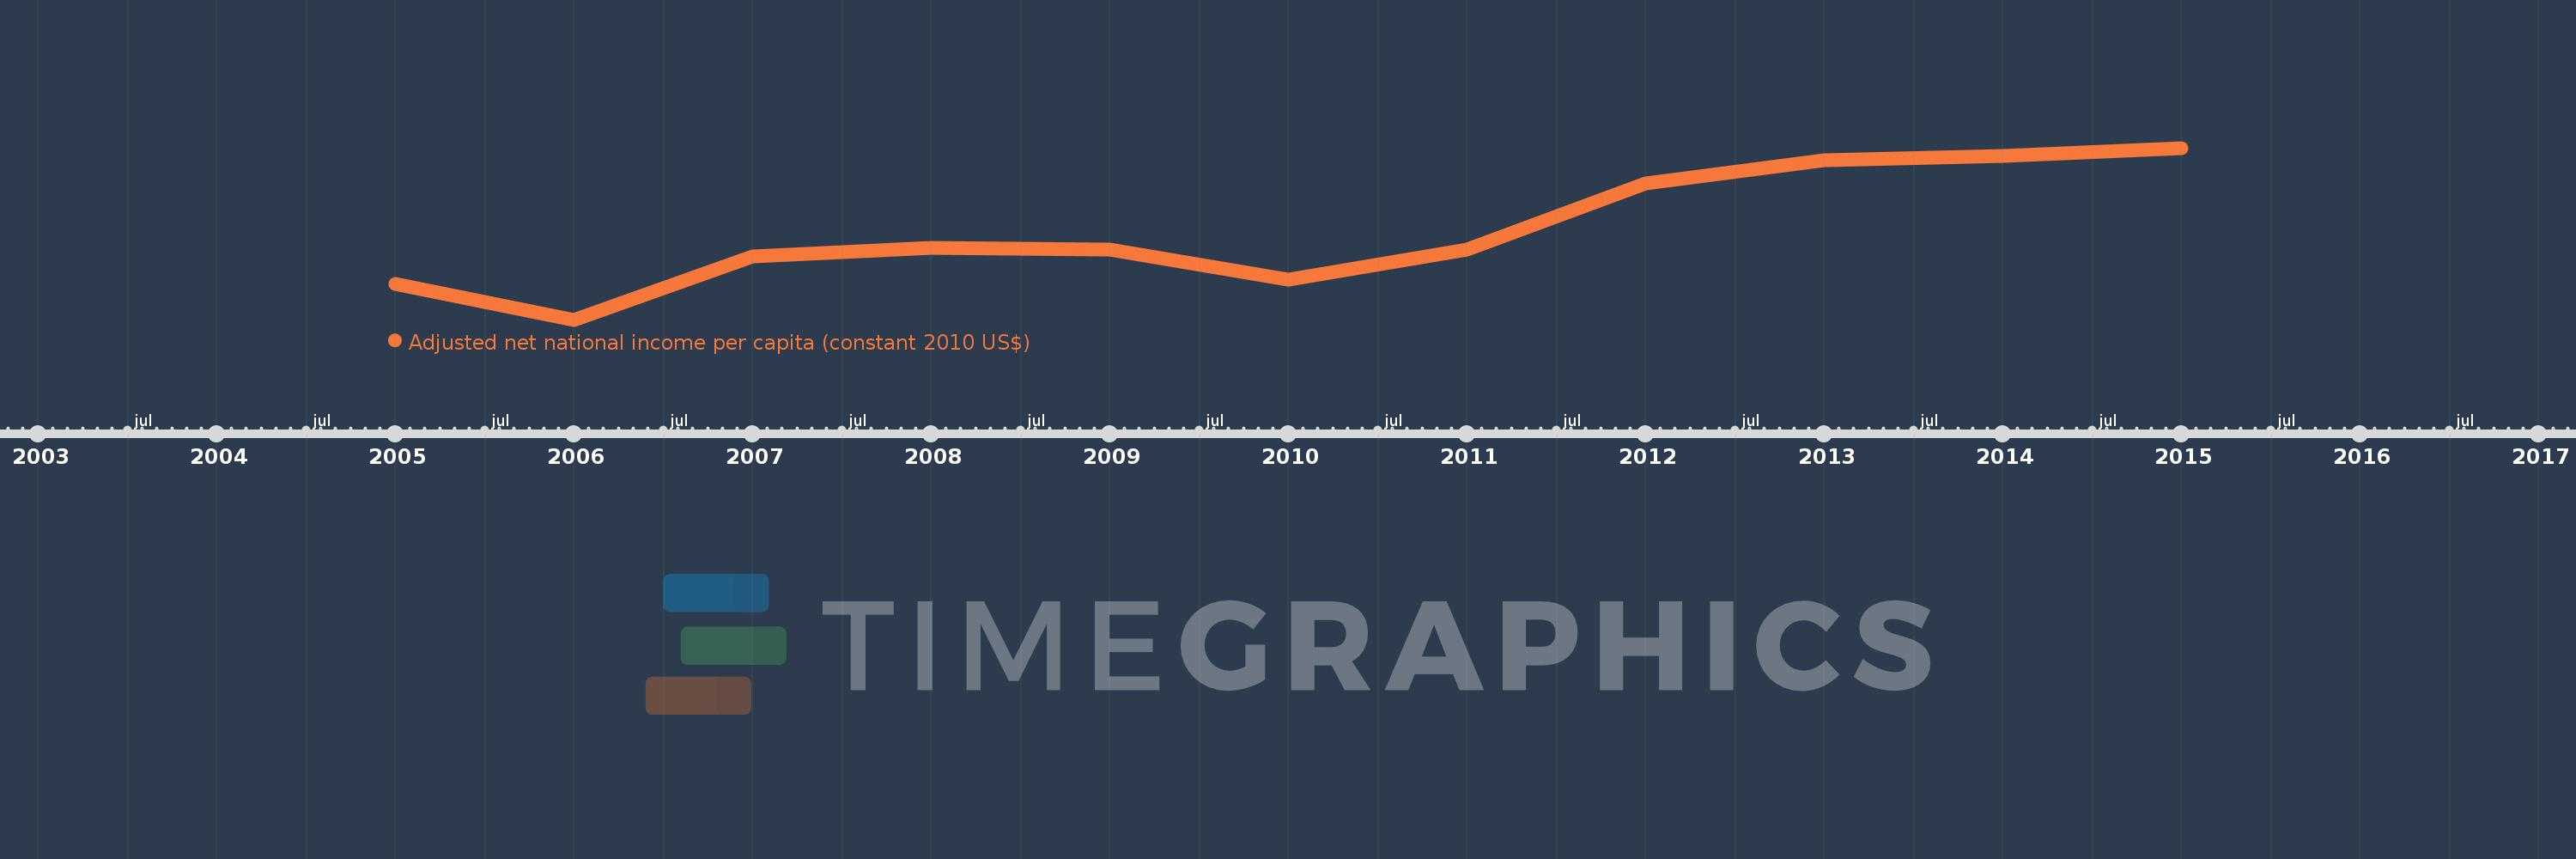
This timeline shows a graph from 2005 to 2015 of Qatar. No data until 2004. Number of actual observations by date: 11.
Source name:
World Development Indicators
Source organization:
NULWorld Bank staff estimates based on sources and methods in World Bank's "The Changing Wealth of Nations: Measuring Sustainable Development in the New Millennium" (2011).L
Categories, topics:
Economy & Growth
Last updated:
apr 23, 2017
Indicators value changes by year
Meaning:
41.141K
Minimum:
27.389K
jan 1, 2006
Maximum:
53.849K
jan 1, 2015
At the date of observation
Value
Absolute change
Change from the previous value
jan 1, 2005
32.844K
+32.844K
0.0%
jan 1, 2006
27.389K
-5.454K
-16.61%
jan 1, 2007
37.11K
+9.721K
35.49%
jan 1, 2008
38.425K
+1.315K
3.54%
jan 1, 2009
38.137K
-287.866
-0.75%
jan 1, 2010
33.56K
-4.577K
-12.0%
jan 1, 2011
38.229K
+4.669K
13.91%
jan 1, 2012
48.377K
+10.148K
26.55%
jan 1, 2013
51.995K
+3.619K
7.48%
jan 1, 2014
52.642K
+646.419
1.24%
jan 1, 2015
53.849K
+1.207K
2.29%
Ranking of countries by current statistics by years