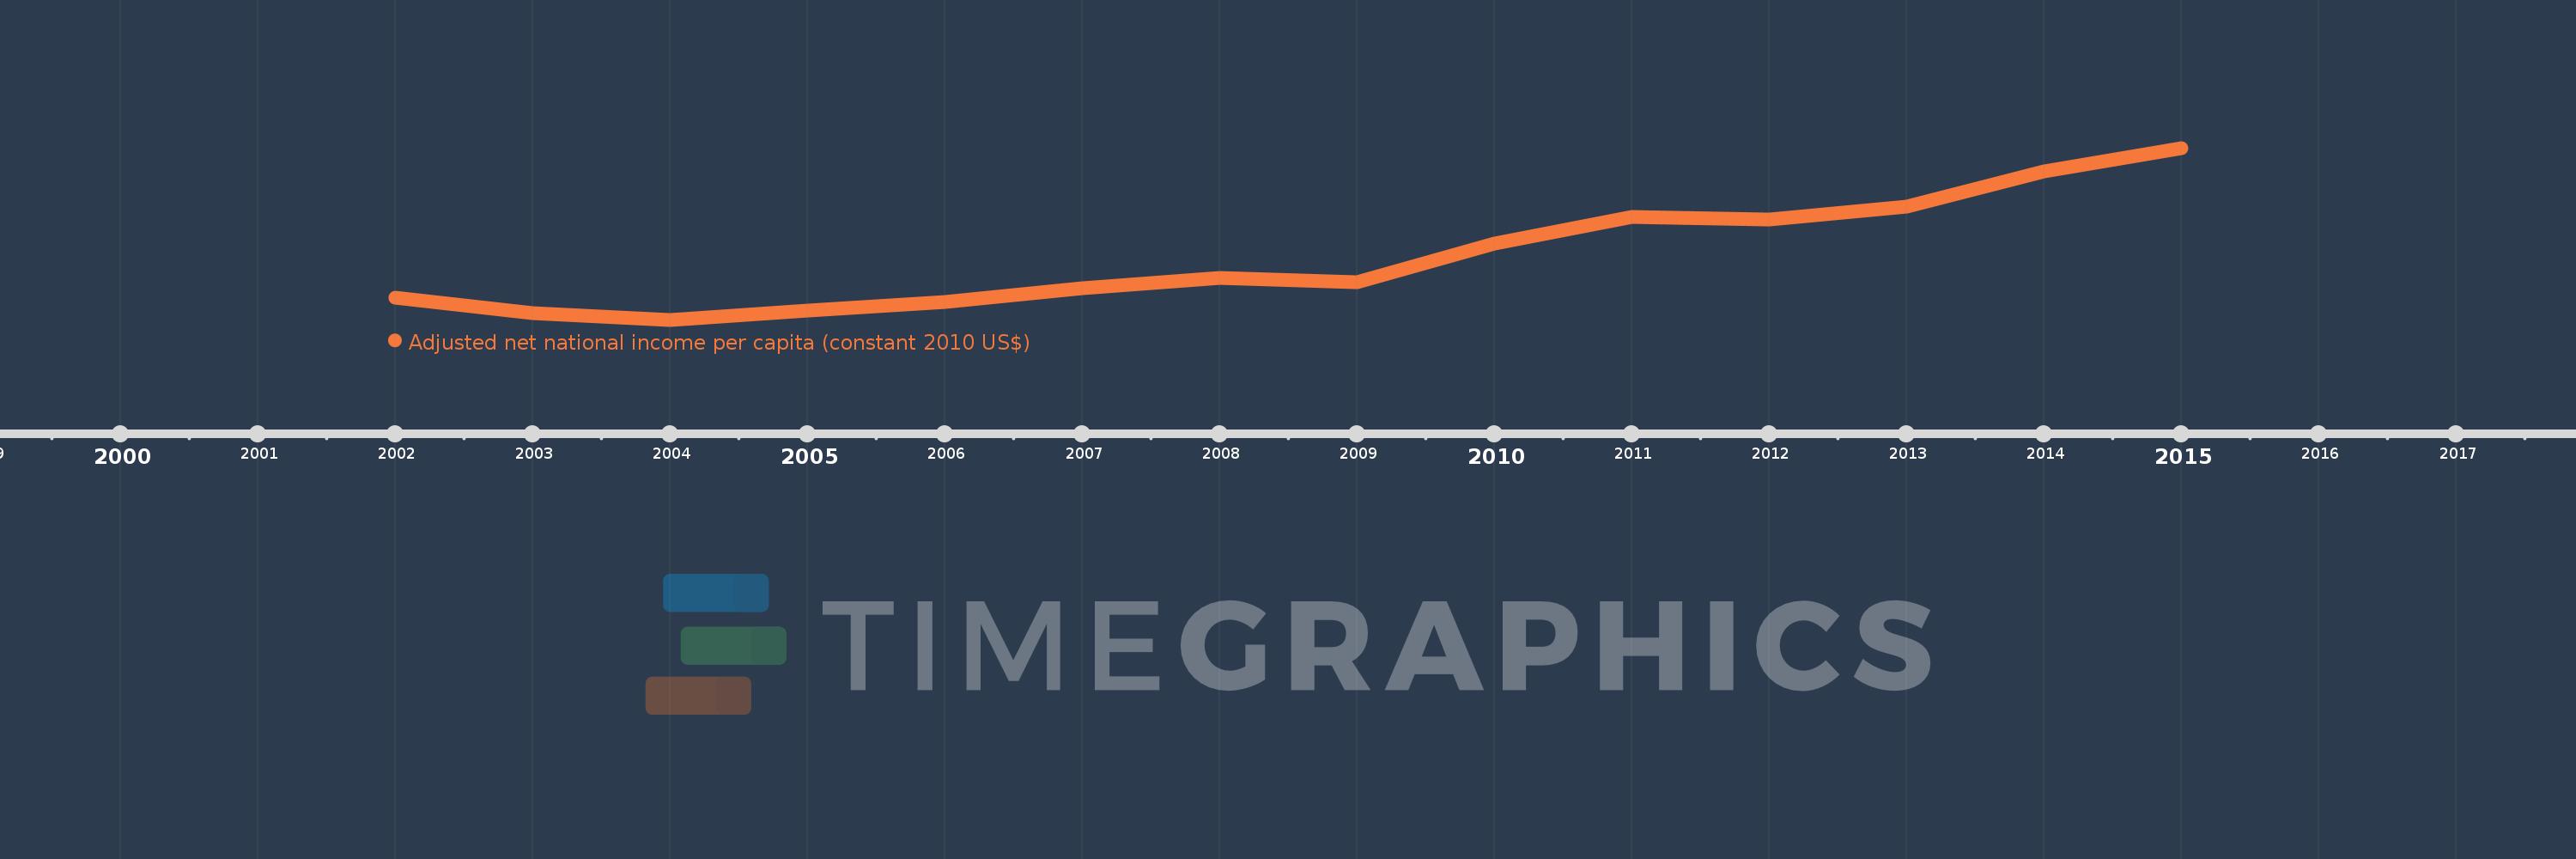
This timeline shows a graph from 2002 to 2015 of Low income. No data until 2001. Number of actual observations by date: 14.
Source name:
World Development Indicators
Source organization:
NULWorld Bank staff estimates based on sources and methods in World Bank's "The Changing Wealth of Nations: Measuring Sustainable Development in the New Millennium" (2011).L
Categories, topics:
Economy & Growth
Last updated:
apr 23, 2017
Indicators value changes by year
Meaning:
399.602
Minimum:
367.597
jan 1, 2004
Maximum:
455.21
jan 1, 2015
At the date of observation
Value
Absolute change
Change from the previous value
jan 1, 2002
378.69
+378.69
0.0%
jan 1, 2003
370.884
-7.806
-2.06%
jan 1, 2004
367.597
-3.288
-0.89%
jan 1, 2005
372.403
+4.807
1.31%
jan 1, 2006
376.452
+4.048
1.09%
jan 1, 2007
383.504
+7.052
1.87%
jan 1, 2008
389.104
+5.601
1.46%
jan 1, 2009
386.717
-2.387
-0.61%
jan 1, 2010
406.487
+19.77
5.11%
jan 1, 2011
420.016
+13.529
3.33%
jan 1, 2012
418.657
-1.358
-0.32%
jan 1, 2013
425.507
+6.85
1.64%
jan 1, 2014
443.203
+17.696
4.16%
jan 1, 2015
455.21
+12.007
2.71%
Ranking of countries by current statistics by years