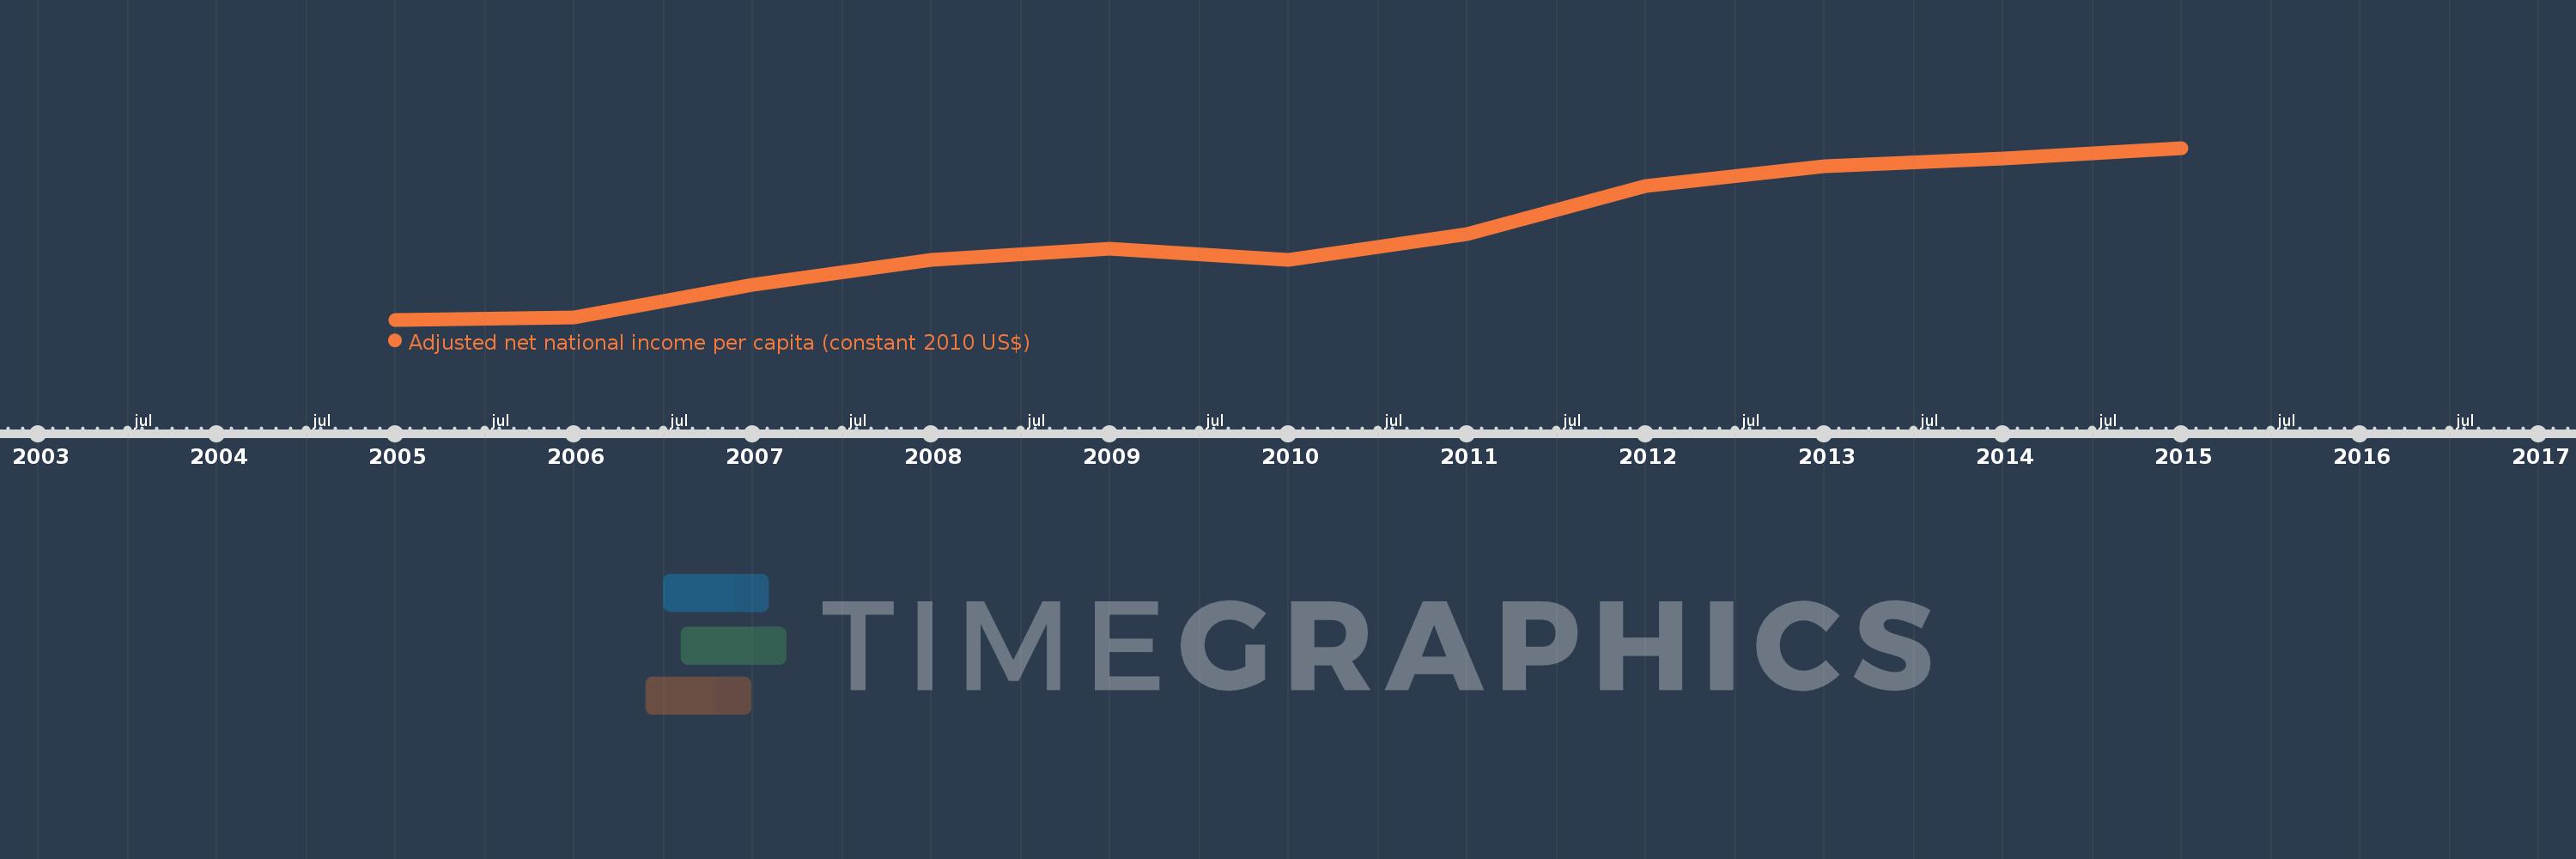
This timeline shows a graph from 2005 to 2015 of Other small states. No data until 2004. Number of actual observations by date: 11.
Source name:
World Development Indicators
Source organization:
NULWorld Bank staff estimates based on sources and methods in World Bank's "The Changing Wealth of Nations: Measuring Sustainable Development in the New Millennium" (2011).L
Categories, topics:
Economy & Growth
Last updated:
apr 23, 2017
Indicators value changes by year
Meaning:
7.659K
Minimum:
5.346K
jan 1, 2005
Maximum:
10.034K
jan 1, 2015
At the date of observation
Value
Absolute change
Change from the previous value
jan 1, 2005
5.346K
+5.346K
0.0%
jan 1, 2006
5.409K
+62.801
1.17%
jan 1, 2007
6.304K
+894.749
16.54%
jan 1, 2008
6.969K
+665.136
10.55%
jan 1, 2009
7.282K
+312.689
4.49%
jan 1, 2010
6.979K
-302.833
-4.16%
jan 1, 2011
7.672K
+693.452
9.94%
jan 1, 2012
8.988K
+1.316K
17.15%
jan 1, 2013
9.526K
+537.975
5.99%
jan 1, 2014
9.736K
+210.46
2.21%
jan 1, 2015
10.034K
+298.082
3.06%
Ranking of countries by current statistics by years