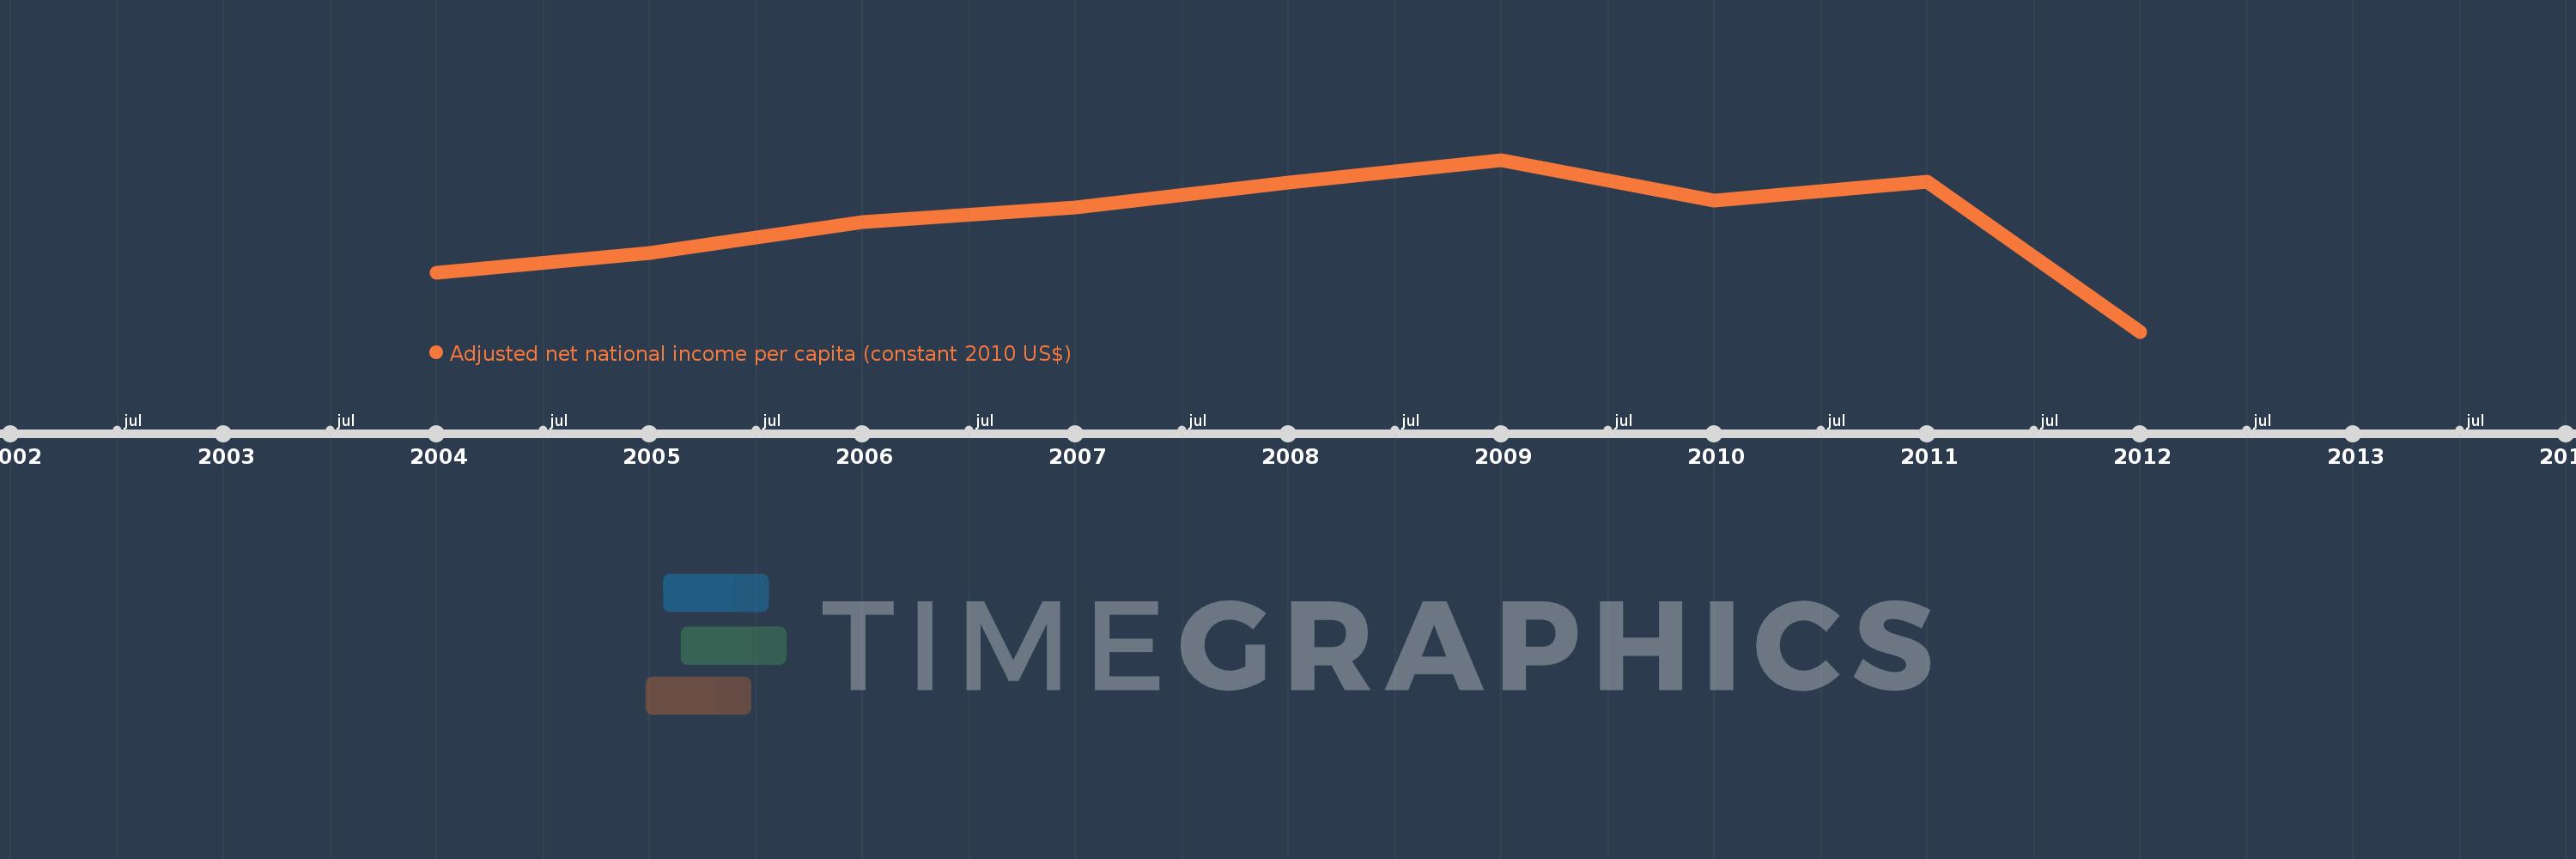
This timeline shows a graph from 2004 to 2012 of Libya. No data until 2003. Number of actual observations by date: 9.
Source name:
World Development Indicators
Source organization:
NULWorld Bank staff estimates based on sources and methods in World Bank's "The Changing Wealth of Nations: Measuring Sustainable Development in the New Millennium" (2011).L
Categories, topics:
Economy & Growth
Last updated:
apr 23, 2017
Indicators value changes by year
Meaning:
6.402K
Minimum:
3.092K
jan 1, 2012
Maximum:
8.355K
jan 1, 2009
At the date of observation
Value
Absolute change
Change from the previous value
jan 1, 2004
4.891K
+4.891K
0.0%
jan 1, 2005
5.495K
+603.58
12.34%
jan 1, 2006
6.439K
+943.947
17.18%
jan 1, 2007
6.884K
+445.717
6.92%
jan 1, 2008
7.663K
+778.971
11.32%
jan 1, 2009
8.355K
+692.241
9.03%
jan 1, 2010
7.117K
-1.239K
-14.83%
jan 1, 2011
7.683K
+566.346
7.96%
jan 1, 2012
3.092K
-4.591K
-59.75%
Ranking of countries by current statistics by years