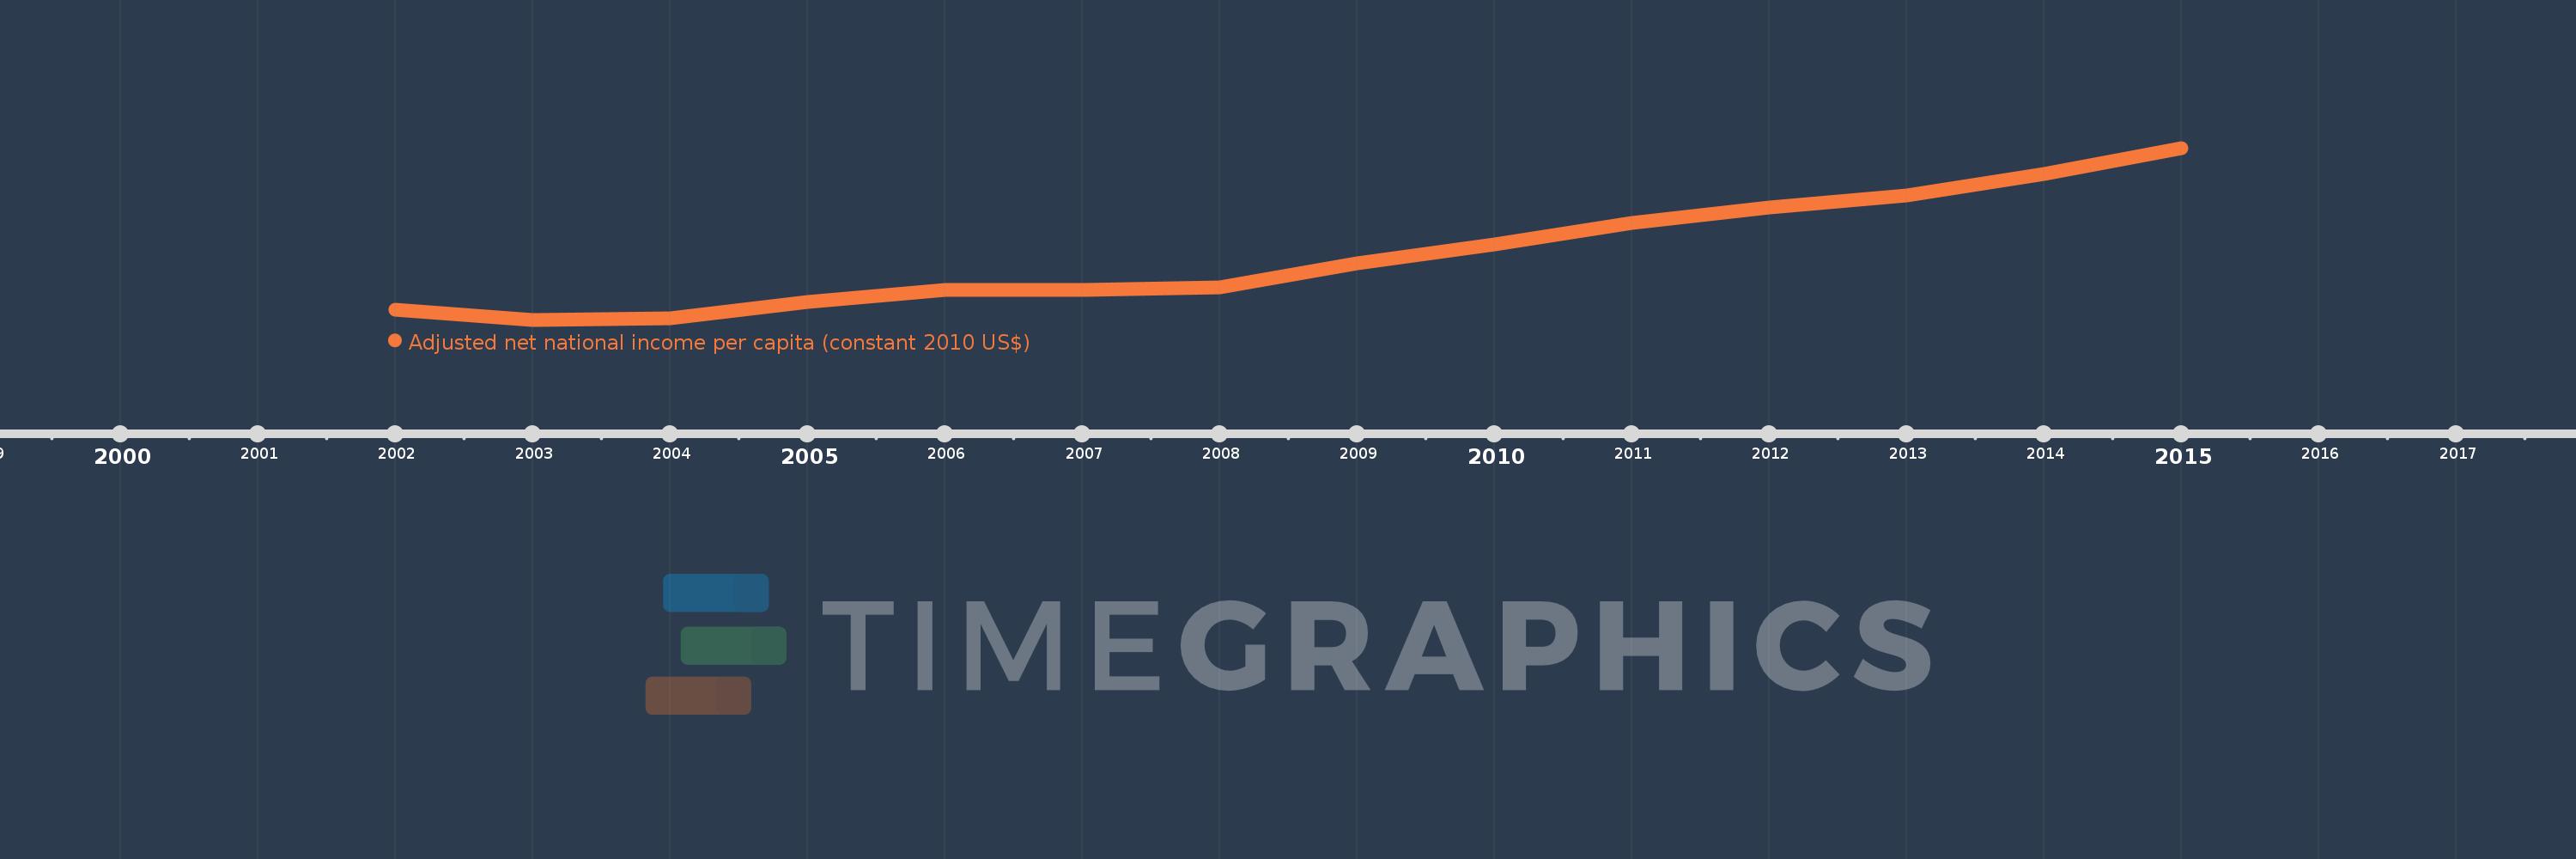
This timeline shows a graph from 2002 to 2015 of Nepal. No data until 2001. Number of actual observations by date: 14.
Source name:
World Development Indicators
Source organization:
NULWorld Bank staff estimates based on sources and methods in World Bank's "The Changing Wealth of Nations: Measuring Sustainable Development in the New Millennium" (2011).L
Categories, topics:
Economy & Growth
Last updated:
apr 23, 2017
Indicators value changes by year
Meaning:
492.864
Minimum:
416.262
jan 1, 2003
Maximum:
619.878
jan 1, 2015
At the date of observation
Value
Absolute change
Change from the previous value
jan 1, 2002
427.798
+427.798
0.0%
jan 1, 2003
416.262
-11.535
-2.7%
jan 1, 2004
418.253
+1.99
0.48%
jan 1, 2005
437.804
+19.551
4.67%
jan 1, 2006
451.671
+13.867
3.17%
jan 1, 2007
451.792
+0.12
0.03%
jan 1, 2008
454.563
+2.771
0.61%
jan 1, 2009
483.528
+28.965
6.37%
jan 1, 2010
506.03
+22.502
4.65%
jan 1, 2011
531.103
+25.073
4.95%
jan 1, 2012
549.233
+18.129
3.41%
jan 1, 2013
563.611
+14.378
2.62%
jan 1, 2014
588.568
+24.958
4.43%
jan 1, 2015
619.878
+31.31
5.32%
Ranking of countries by current statistics by years