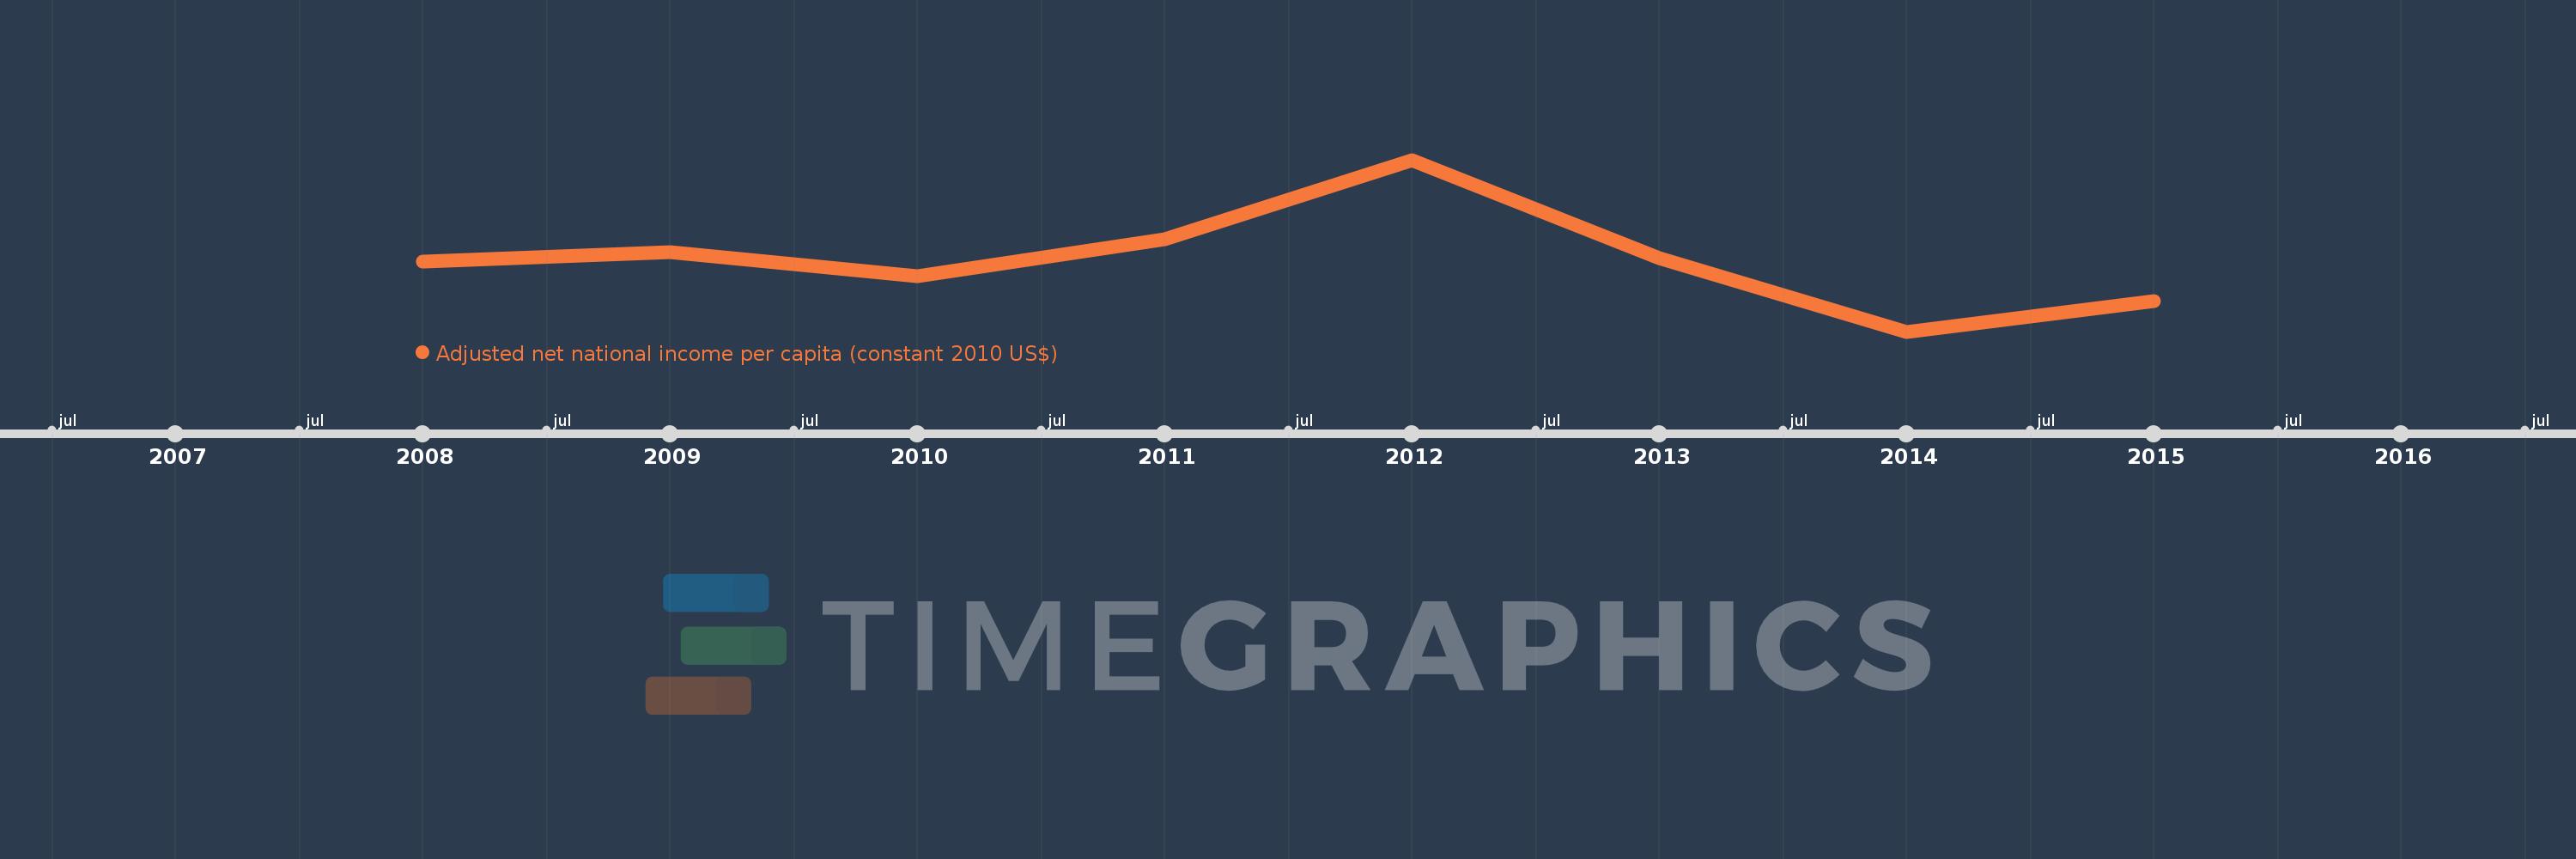
This timeline shows a graph from 2008 to 2015 of Guinea-Bissau. No data until 2007. Number of actual observations by date: 8.
Source name:
World Development Indicators
Source organization:
NULWorld Bank staff estimates based on sources and methods in World Bank's "The Changing Wealth of Nations: Measuring Sustainable Development in the New Millennium" (2011).L
Categories, topics:
Economy & Growth
Last updated:
apr 23, 2017
Indicators value changes by year
Meaning:
396.6
Minimum:
339.706
jan 1, 2014
Maximum:
476.217
jan 1, 2012
At the date of observation
Value
Absolute change
Change from the previous value
jan 1, 2008
395.004
+395.004
0.0%
jan 1, 2009
403.161
+8.156
2.06%
jan 1, 2010
383.949
-19.211
-4.77%
jan 1, 2011
412.821
+28.872
7.52%
jan 1, 2012
476.217
+63.395
15.36%
jan 1, 2013
398.27
-77.947
-16.37%
jan 1, 2014
339.706
-58.564
-14.7%
jan 1, 2015
363.672
+23.966
7.06%
Ranking of countries by current statistics by years