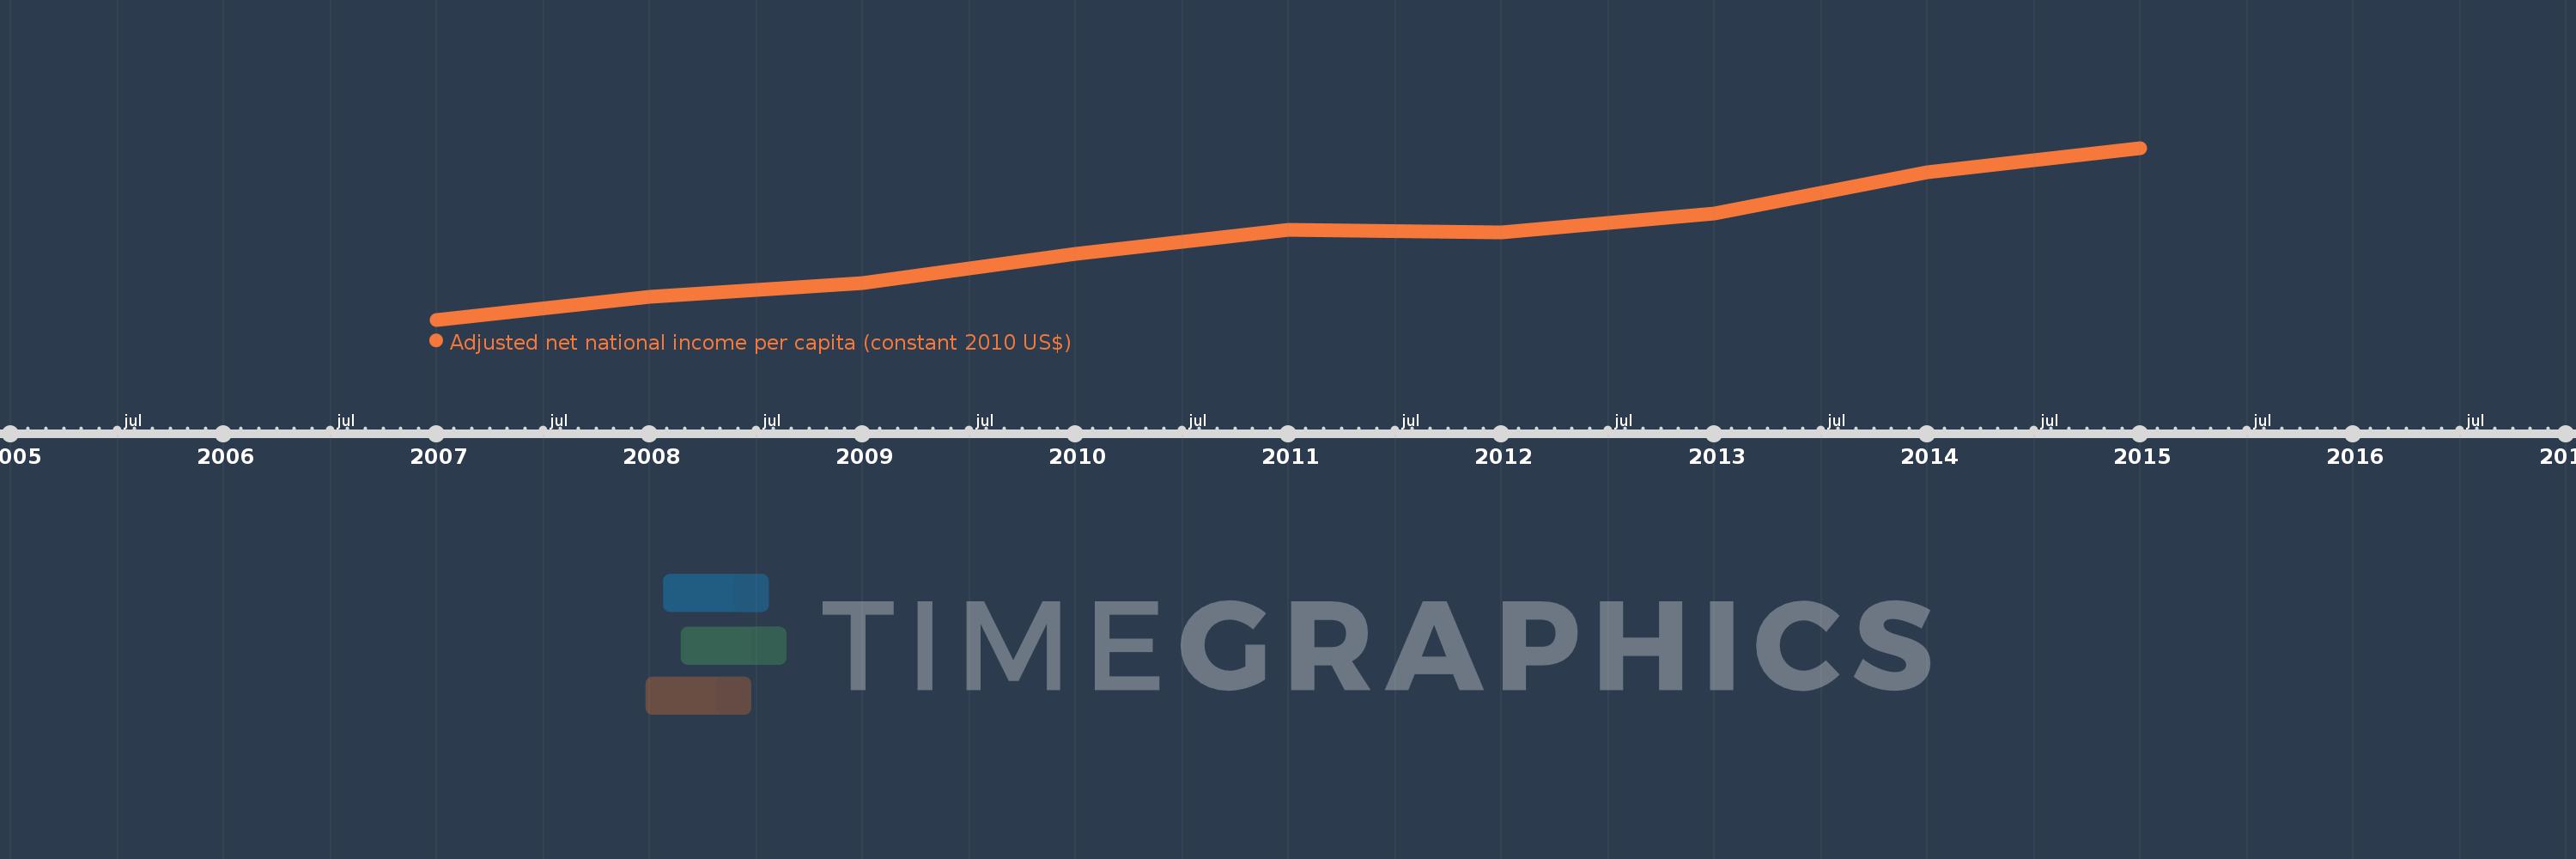
This timeline shows a graph from 2007 to 2015 of Heavily indebted poor countries (HIPC). No data until 2006. Number of actual observations by date: 9.
Source name:
World Development Indicators
Source organization:
NULWorld Bank staff estimates based on sources and methods in World Bank's "The Changing Wealth of Nations: Measuring Sustainable Development in the New Millennium" (2011).L
Categories, topics:
Economy & Growth
Last updated:
apr 23, 2017
Indicators value changes by year
Meaning:
566.668
Minimum:
516.488
jan 1, 2007
Maximum:
623.063
jan 1, 2015
At the date of observation
Value
Absolute change
Change from the previous value
jan 1, 2007
516.488
+516.488
0.0%
jan 1, 2008
530.718
+14.23
2.76%
jan 1, 2009
539.466
+8.747
1.65%
jan 1, 2010
557.171
+17.705
3.28%
jan 1, 2011
572.049
+14.878
2.67%
jan 1, 2012
570.718
-1.331
-0.23%
jan 1, 2013
582.612
+11.895
2.08%
jan 1, 2014
607.724
+25.112
4.31%
jan 1, 2015
623.063
+15.339
2.52%
Ranking of countries by current statistics by years