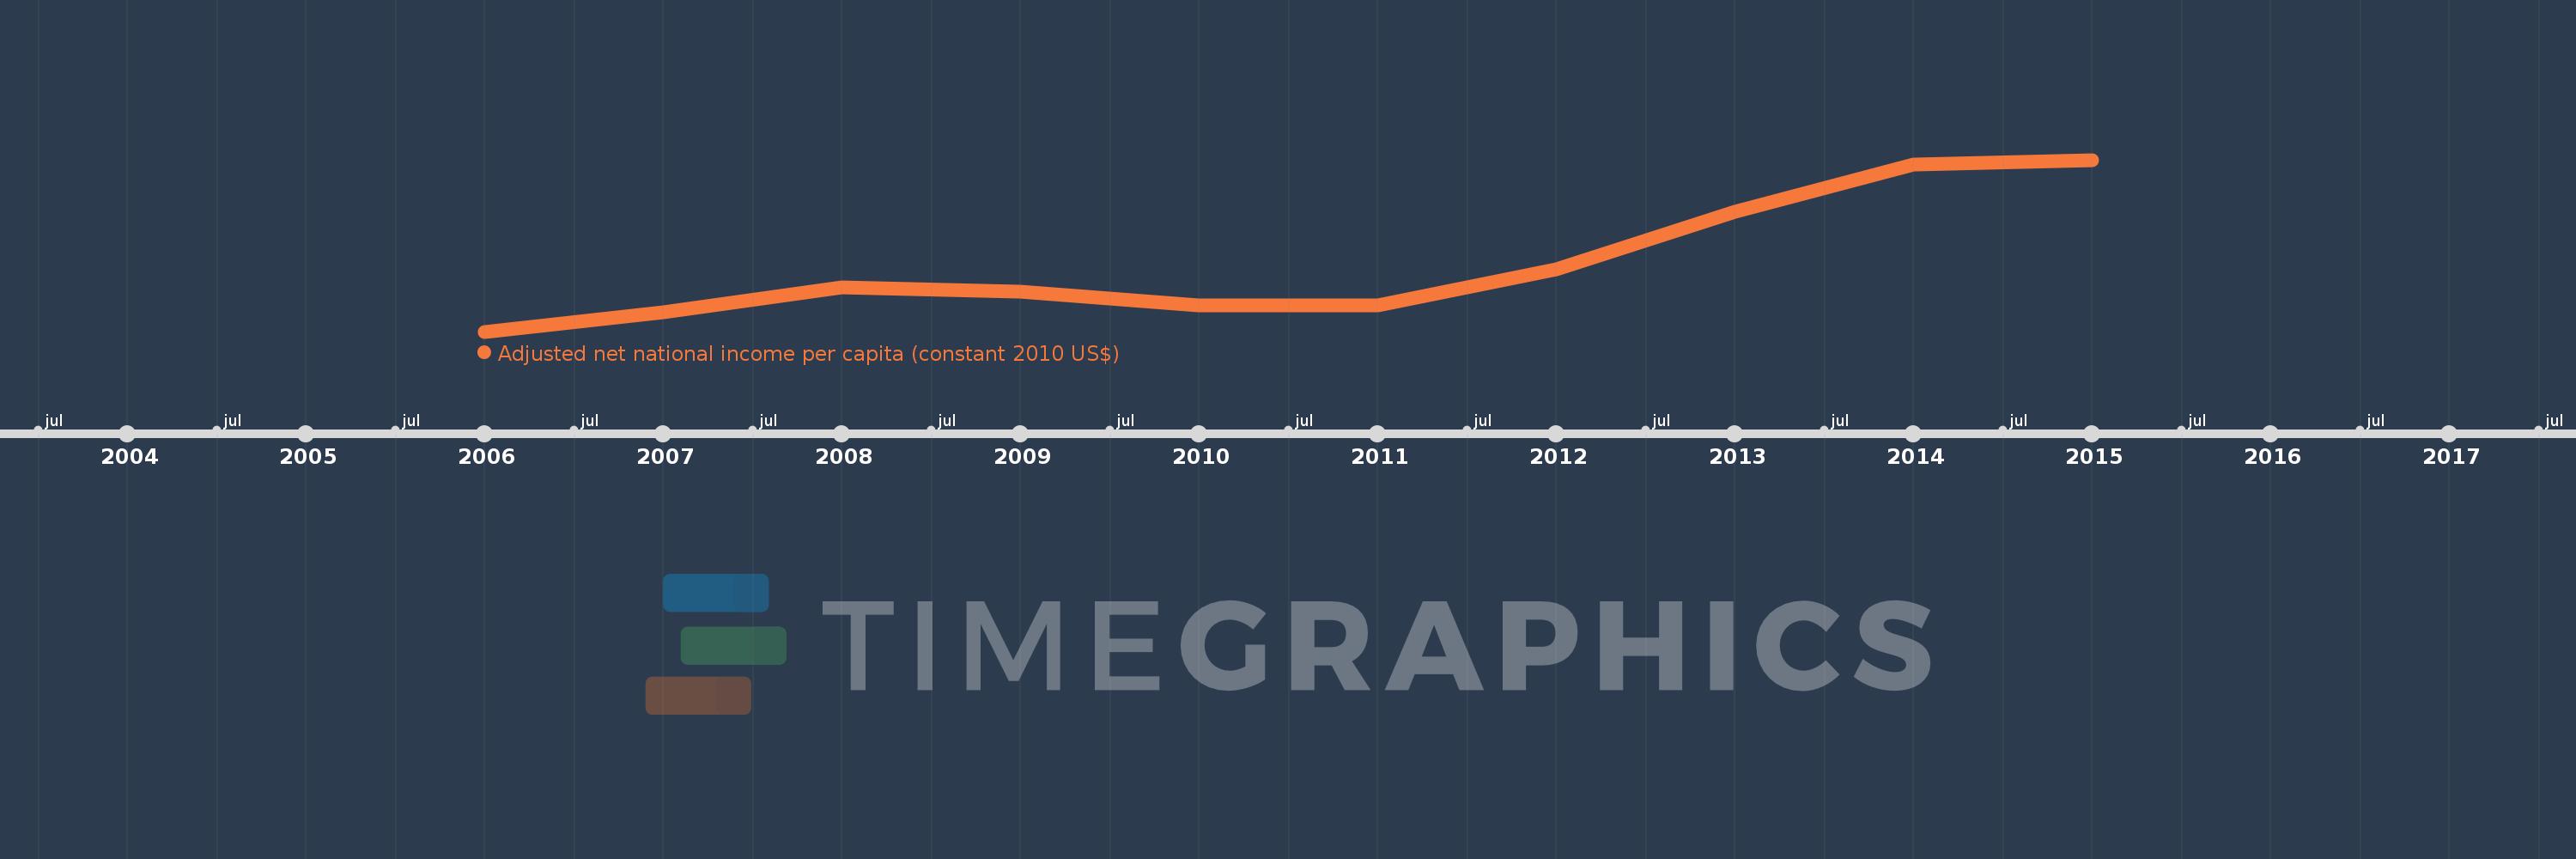
This timeline shows a graph from 2006 to 2015 of Mongolia. No data until 2005. Number of actual observations by date: 10.
Source name:
World Development Indicators
Source organization:
NULWorld Bank staff estimates based on sources and methods in World Bank's "The Changing Wealth of Nations: Measuring Sustainable Development in the New Millennium" (2011).L
Categories, topics:
Economy & Growth
Last updated:
apr 23, 2017
Indicators value changes by year
Meaning:
2.121K
Minimum:
1.578K
jan 1, 2006
Maximum:
2.957K
jan 1, 2015
At the date of observation
Value
Absolute change
Change from the previous value
jan 1, 2006
1.578K
+1.578K
0.0%
jan 1, 2007
1.732K
+154.506
9.79%
jan 1, 2008
1.936K
+203.824
11.77%
jan 1, 2009
1.898K
-38.16
-1.97%
jan 1, 2010
1.788K
-109.902
-5.79%
jan 1, 2011
1.786K
-1.574
-0.09%
jan 1, 2012
2.074K
+288.024
16.12%
jan 1, 2013
2.541K
+466.487
22.49%
jan 1, 2014
2.919K
+378.392
14.89%
jan 1, 2015
2.957K
+37.826
1.3%
Ranking of countries by current statistics by years