29
/
en
AIzaSyAYiBZKx7MnpbEhh9jyipgxe19OcubqV5w
April 1, 2024
36324
IBRD only
IBD
false
2
1
Adjusted net national income per capita (constant 2010 US$)
2013,2012,2011,2010,2009,2008,2007,2006,2005,2004,2003,2002,2001,2000,1999,1998,1997,1996
Download
Global statistics library →IBRD only →

Adjusted net national income per capita (constant 2010 US$)

This statistics in other country:
AfghanistanAlbaniaAlgeriaAngolaArab WorldArgentinaArmeniaAustraliaAustriaAzerbaijanBahamas, TheBahrainBangladeshBarbadosBelarusBelgiumBelizeBeninBhutanBoliviaBotswanaBrazilBulgariaBurkina FasoBurundiCabo VerdeCambodiaCameroonCanadaCaribbean small statesCentral African RepublicCentral Europe and the BalticsChadChileChinaColombiaComorosCongo, Dem. Rep.Congo, Rep.Costa RicaCote d'IvoireCroatiaCubaCyprusCzech RepublicDenmarkDominicaDominican RepublicEarly-demographic dividendEast Asia & PacificEast Asia & Pacific (excluding high income)East Asia & Pacific (IDA & IBRD countries)EcuadorEgypt, Arab Rep.El SalvadorEritreaEstoniaEthiopiaEuro areaEurope & Central AsiaEurope & Central Asia (excluding high income)Europe & Central Asia (IDA & IBRD countries)European UnionFijiFinlandFragile and conflict affected situationsFranceGabonGambia, TheGeorgiaGermanyGhanaGreeceGuatemalaGuineaGuinea-BissauGuyanaHaitiHeavily indebted poor countries (HIPC)High incomeHondurasHungaryIBRD onlyIDA & IBRD totalIDA blendIDA onlyIDA totalIndiaIndonesiaIran, Islamic Rep.IraqIrelandIsraelItalyJamaicaJapanJordanKazakhstanKenyaKiribatiKorea, Rep.KuwaitKyrgyz RepublicLao PDRLate-demographic dividendLatin America & Caribbean Latin America & Caribbean (excluding high income)Latin America & the Caribbean (IDA & IBRD countries)LatviaLeast developed countries: UN classificationLebanonLesothoLiberiaLibyaLithuaniaLow & middle incomeLow incomeLower middle incomeLuxembourgMacedonia, FYRMadagascarMalawiMalaysiaMaldivesMaliMauritaniaMauritiusMexicoMiddle East & North AfricaMiddle East & North Africa (excluding high income)Middle East & North Africa (IDA & IBRD countries)Middle incomeMoldovaMongoliaMoroccoMozambiqueNamibiaNepalNetherlandsNew ZealandNicaraguaNigerNigeriaNorth AmericaNorwayOECD membersOmanOther small statesPacific island small statesPakistanPanamaPapua New GuineaParaguayPeruPhilippinesPolandPortugalPost-demographic dividendPre-demographic dividendQatarRomaniaRussian FederationRwandaSamoaSao Tome and PrincipeSaudi ArabiaSenegalSeychellesSierra LeoneSingaporeSlovak RepublicSloveniaSmall statesSolomon IslandsSouth AfricaSouth AsiaSouth Asia (IDA & IBRD)SpainSri LankaSt. LuciaSt. Vincent and the GrenadinesSub-Saharan Africa Sub-Saharan Africa (excluding high income)Sub-Saharan Africa (IDA & IBRD countries)SurinameSwazilandSwedenSwitzerlandTajikistanTanzaniaThailandTogoTongaTrinidad and TobagoTunisiaTurkeyTurkmenistanUgandaUkraineUnited Arab EmiratesUnited KingdomUnited StatesUpper middle incomeUruguayUzbekistanVanuatuVenezuela, RBVietnamWorldYemen, Rep.ZambiaZimbabwe
Timeline:
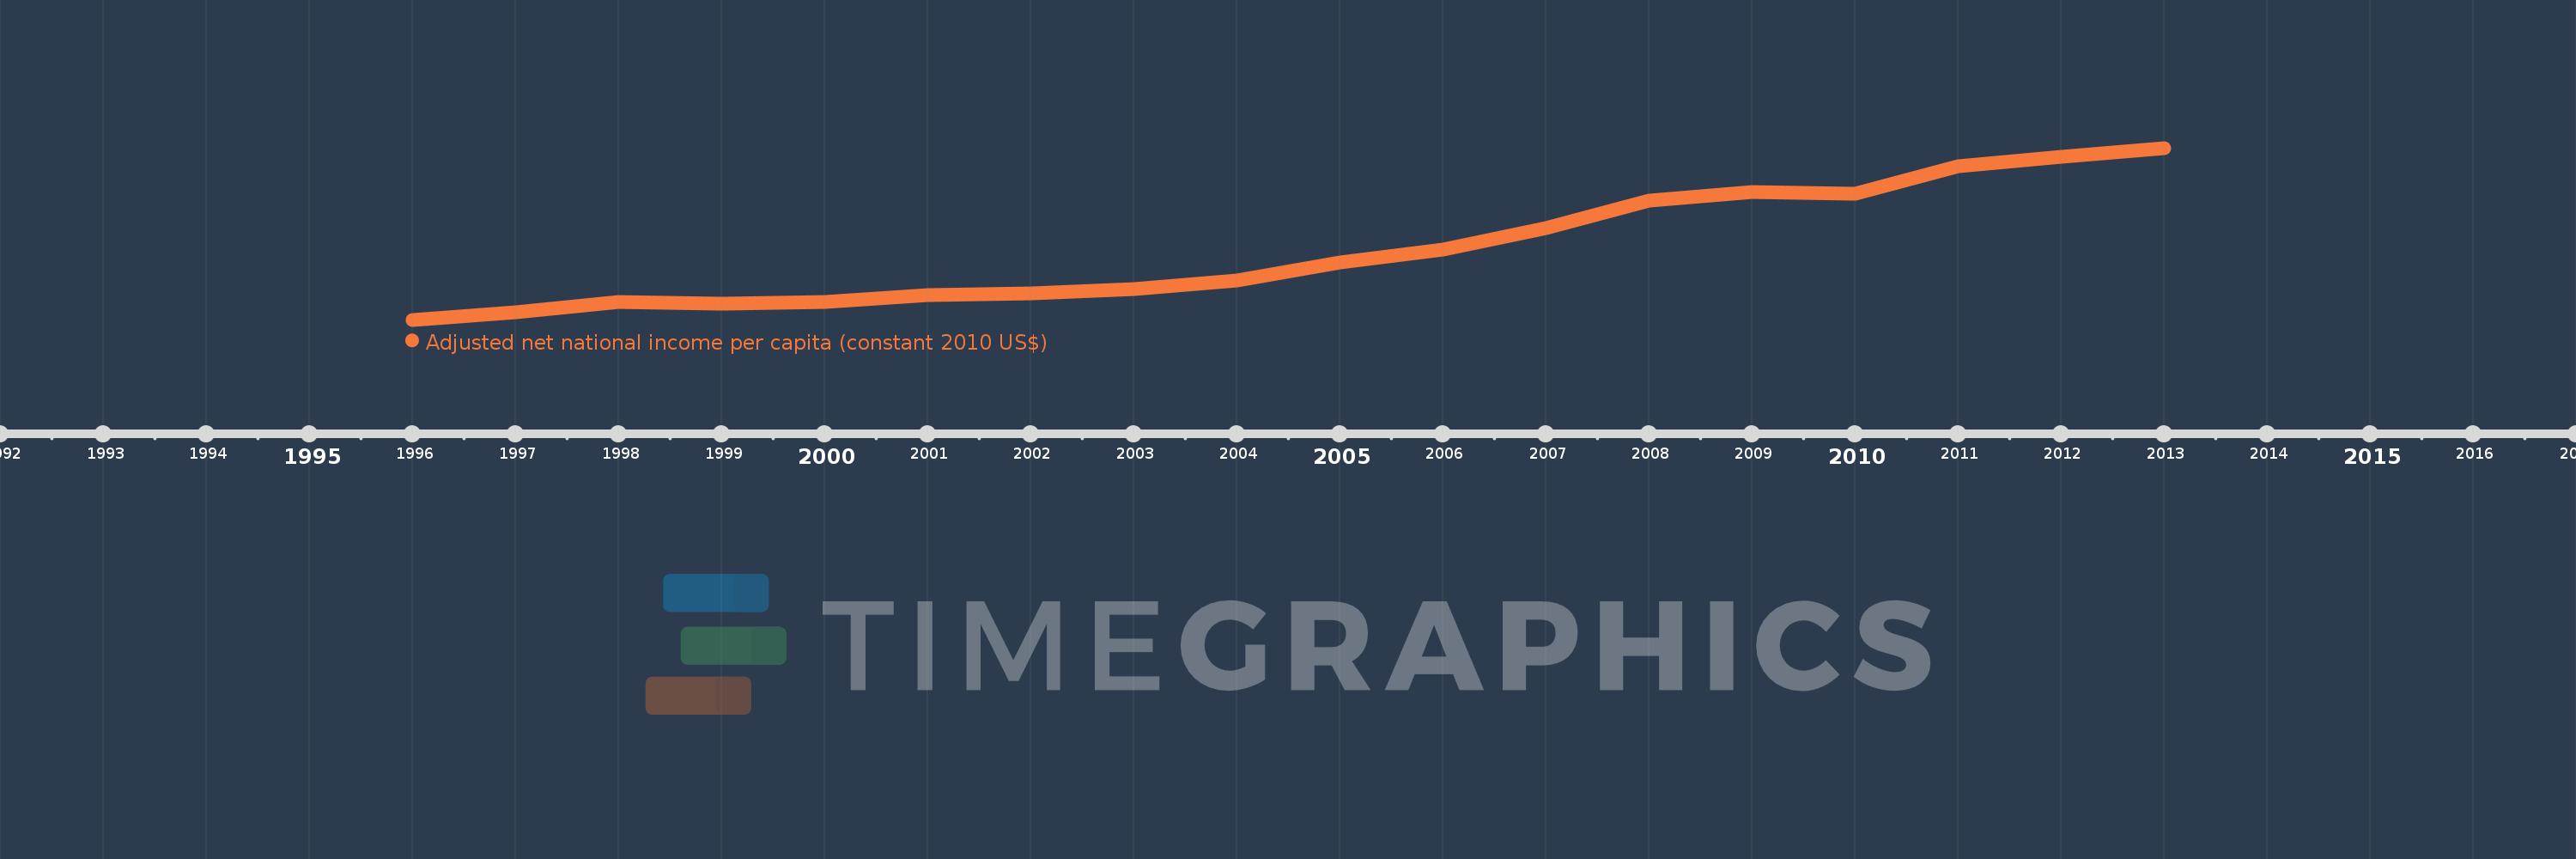
This timeline shows a graph from 1996 to 2013 of IBRD only. No data until 1995. Number of actual observations by date: 18.
Source name:
World Development Indicators
Source organization:
NULWorld Bank staff estimates based on sources and methods in World Bank's "The Changing Wealth of Nations: Measuring Sustainable Development in the New Millennium" (2011).L
Categories, topics:
Economy & Growth
Last updated:
apr 23, 2017
Indicators value changes by year
Mean:
3.008K
Minimum:
2.352K
jan 1, 1996
Maximum:
3.961K
jan 1, 2013
At the date of observation
Value
Absolute change
Change from previous value
jan 1, 1996
2.352K
+2.352K
0.0%
jan 1, 1997
2.423K
+71.569
3.04%
jan 1, 1998
2.518K
+94.554
3.9%
jan 1, 1999
2.505K
-12.768
-0.51%
jan 1, 2000
2.519K
+13.902
0.55%
jan 1, 2001
2.581K
+61.459
2.44%
jan 1, 2002
2.597K
+16.731
0.65%
jan 1, 2003
2.639K
+41.894
1.61%
jan 1, 2004
2.719K
+79.461
3.01%
jan 1, 2005
2.889K
+170.11
6.26%
jan 1, 2006
3.011K
+122.653
4.25%
jan 1, 2007
3.213K
+201.447
6.69%
jan 1, 2008
3.469K
+256.45
7.98%
jan 1, 2009
3.55K
+81.014
2.34%
jan 1, 2010
3.534K
-16.272
-0.46%
jan 1, 2011
3.788K
+254.345
7.2%
jan 1, 2012
3.881K
+92.494
2.44%
jan 1, 2013
3.961K
+79.762
2.06%
Ranking of countries by current statistics by years

Comments:

Send
PremiumAbout & FeedbackTermsPrivacy
logo
© 2022 Selected Technologies LLC – Morgan Hill, California