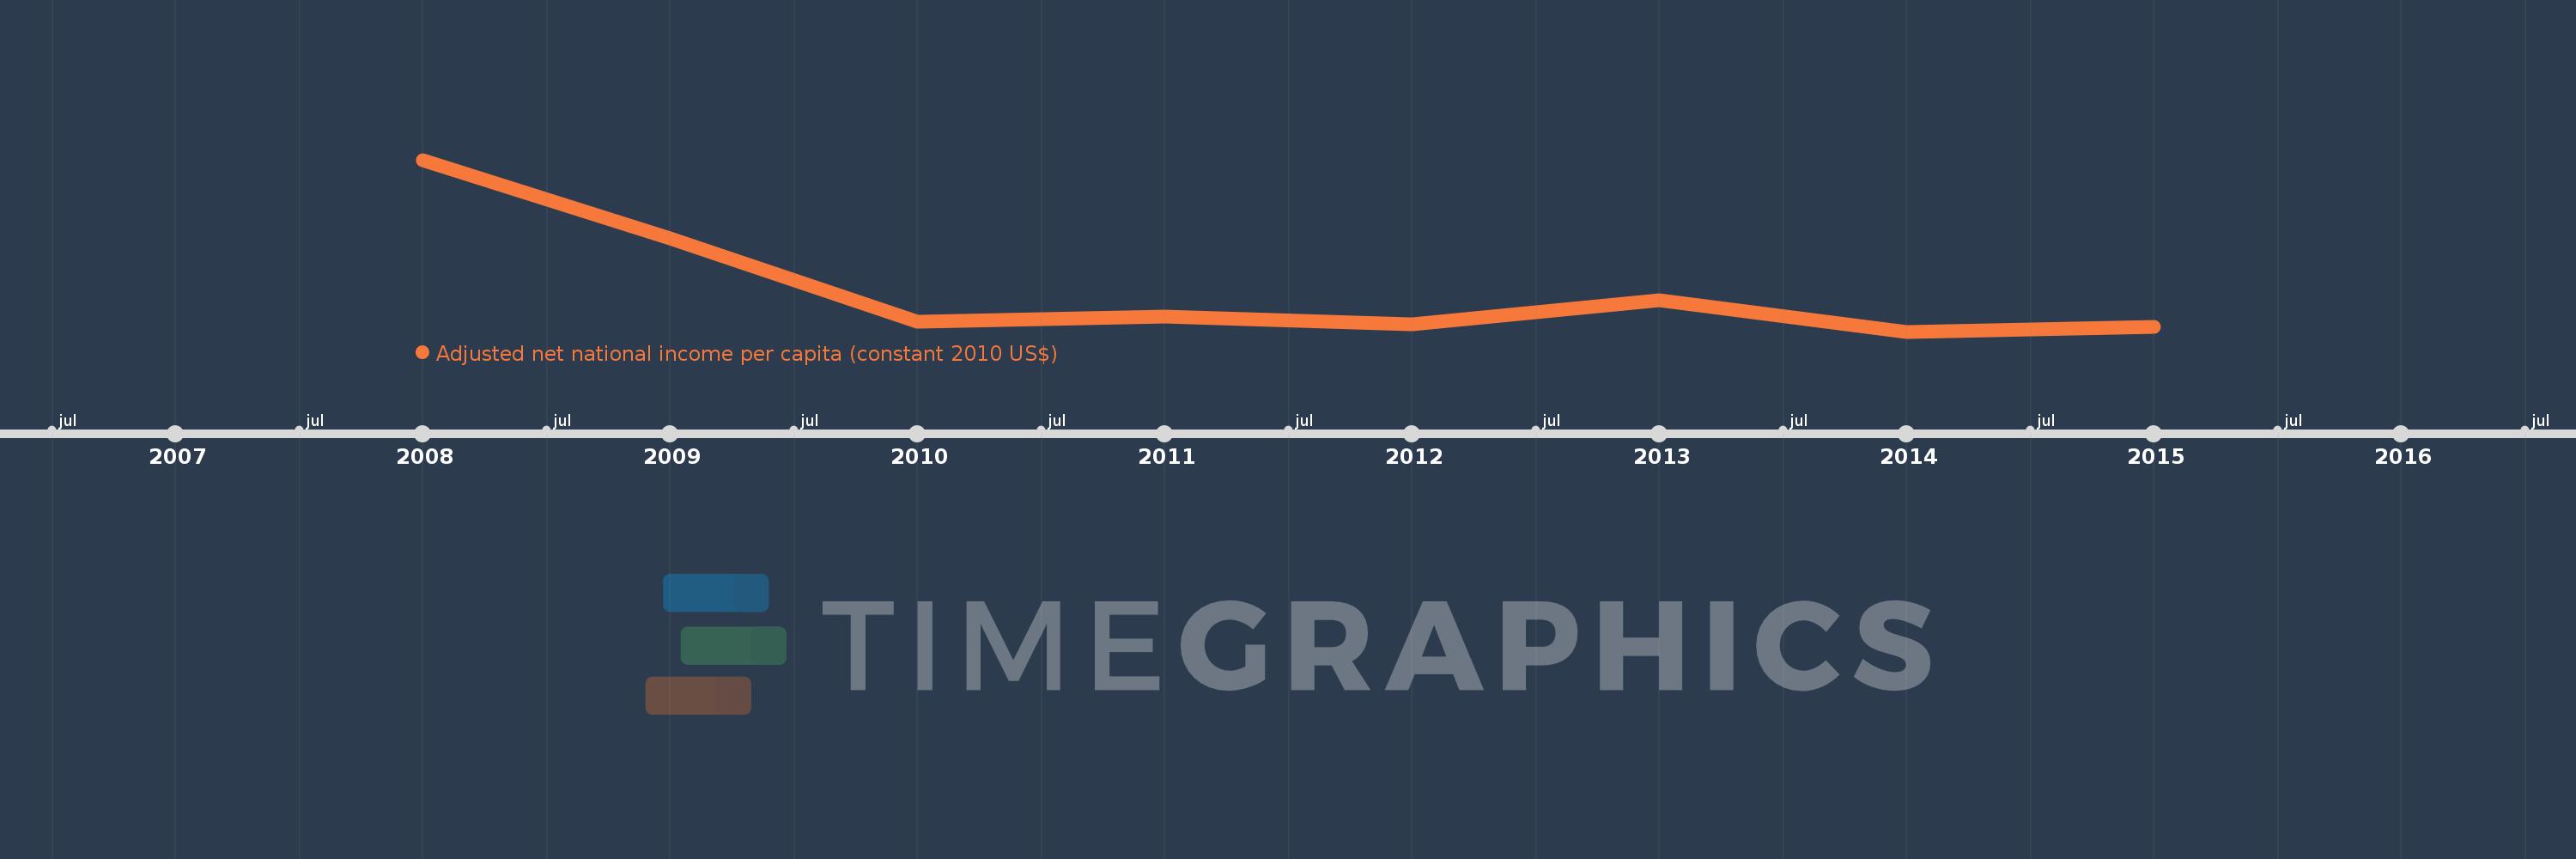
This timeline shows a graph from 2008 to 2015 of Jamaica. No data until 2007. Number of actual observations by date: 8.
Source name:
World Development Indicators
Source organization:
NULWorld Bank staff estimates based on sources and methods in World Bank's "The Changing Wealth of Nations: Measuring Sustainable Development in the New Millennium" (2011).L
Categories, topics:
Economy & Growth
Last updated:
apr 23, 2017
Indicators value changes by year
Meaning:
4.36K
Minimum:
4.246K
jan 1, 2014
Maximum:
4.716K
jan 1, 2008
At the date of observation
Value
Absolute change
Change from the previous value
jan 1, 2008
4.716K
+4.716K
0.0%
jan 1, 2009
4.502K
-214.508
-4.55%
jan 1, 2010
4.273K
-228.533
-5.08%
jan 1, 2011
4.286K
+12.722
0.3%
jan 1, 2012
4.266K
-19.325
-0.45%
jan 1, 2013
4.332K
+65.52
1.54%
jan 1, 2014
4.246K
-86.376
-1.99%
jan 1, 2015
4.258K
+12.779
0.3%
Ranking of countries by current statistics by years