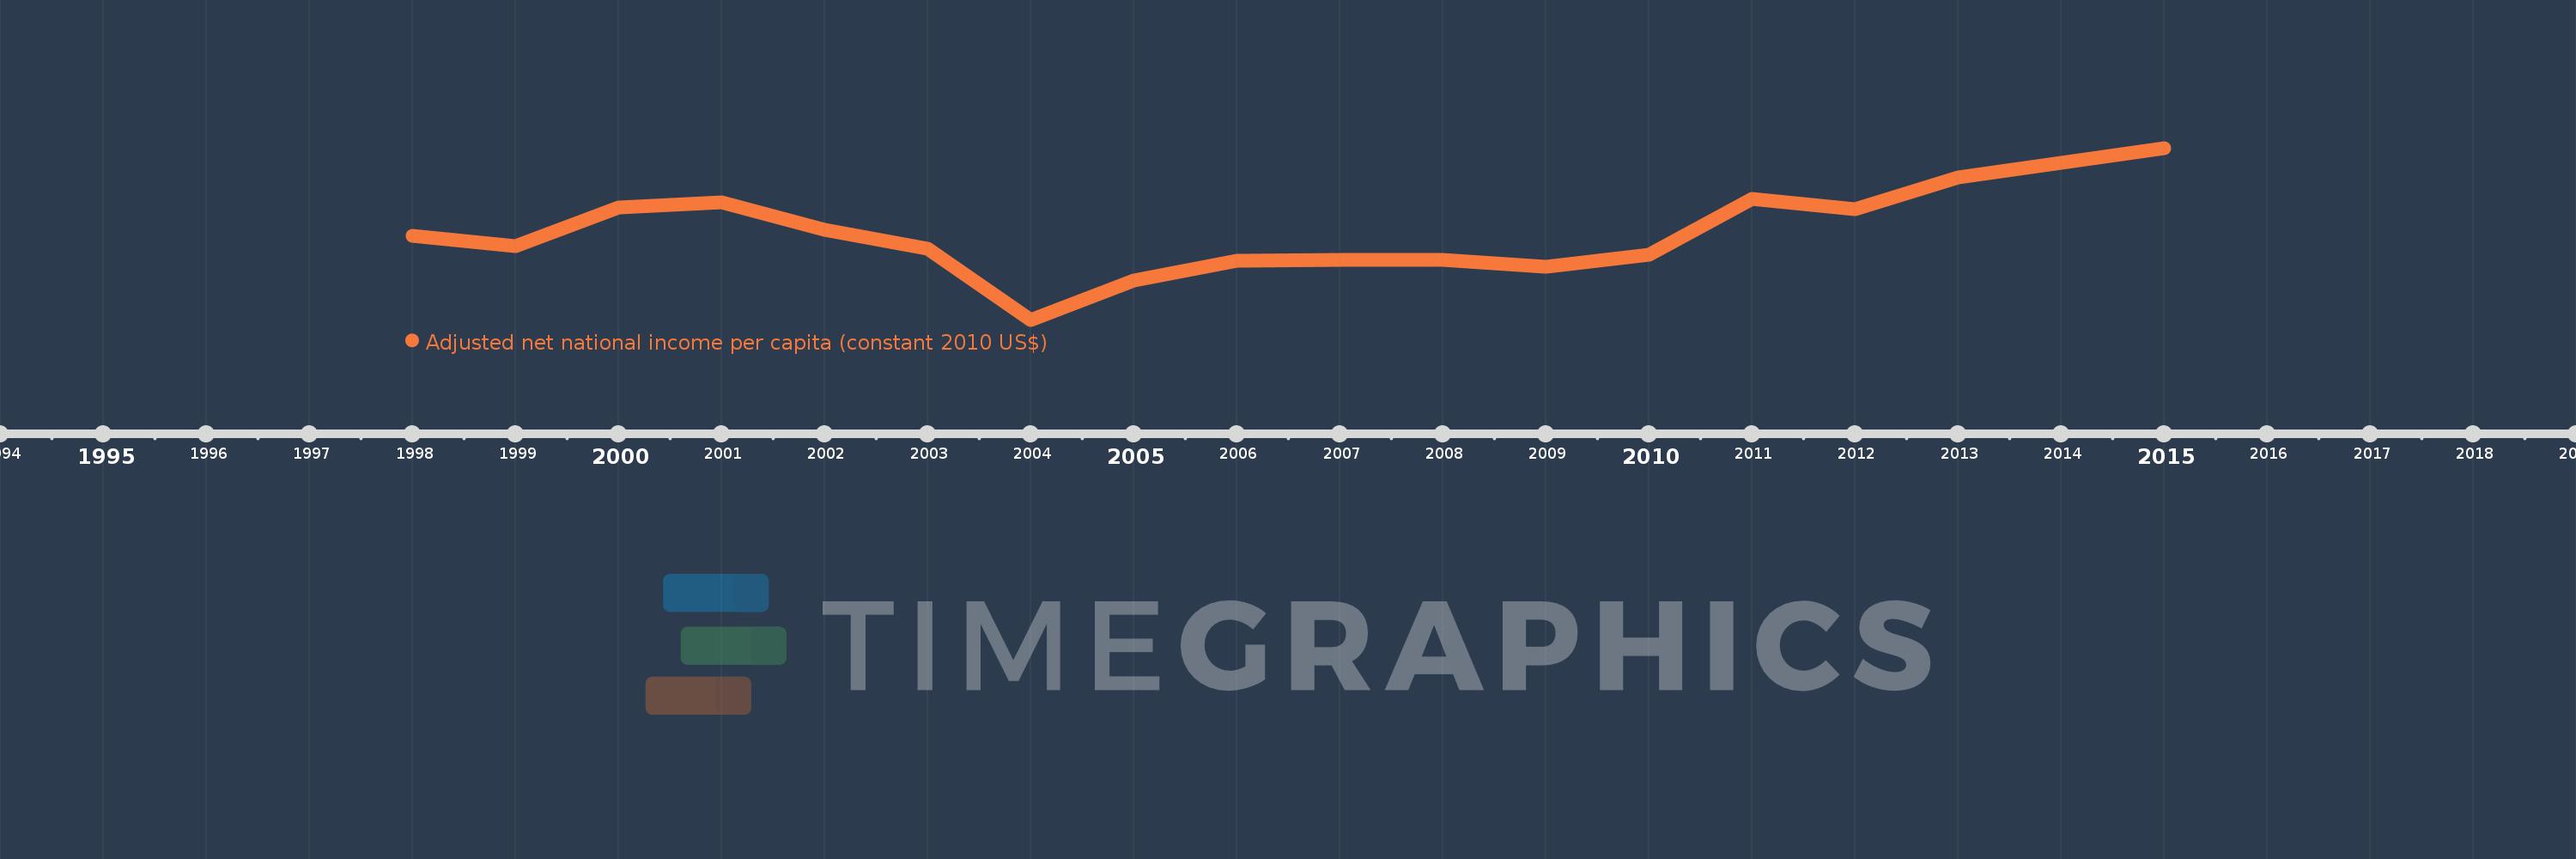
This timeline shows a graph from 1998 to 2015 of Burundi. No data until 1997. Number of actual observations by date: 18.
Source name:
World Development Indicators
Source organization:
NULWorld Bank staff estimates based on sources and methods in World Bank's "The Changing Wealth of Nations: Measuring Sustainable Development in the New Millennium" (2011).L
Categories, topics:
Economy & Growth
Last updated:
apr 23, 2017
Indicators value changes by year
Meaning:
114.892
Minimum:
71.885
jan 1, 2004
Maximum:
155.684
jan 1, 2015
At the date of observation
Value
Absolute change
Change from the previous value
jan 1, 1998
112.967
+112.967
0.0%
jan 1, 1999
107.827
-5.141
-4.55%
jan 1, 2000
126.833
+19.006
17.63%
jan 1, 2001
129.158
+2.325
1.83%
jan 1, 2002
115.722
-13.435
-10.4%
jan 1, 2003
106.615
-9.107
-7.87%
jan 1, 2004
71.885
-34.73
-32.58%
jan 1, 2005
90.914
+19.029
26.47%
jan 1, 2006
100.569
+9.655
10.62%
jan 1, 2007
101.163
+0.594
0.59%
jan 1, 2008
100.999
-0.165
-0.16%
jan 1, 2009
97.637
-3.362
-3.33%
jan 1, 2010
103.475
+5.839
5.98%
jan 1, 2011
130.955
+27.479
26.56%
jan 1, 2012
125.779
-5.176
-3.95%
jan 1, 2013
141.377
+15.599
12.4%
jan 1, 2014
148.495
+7.118
5.03%
jan 1, 2015
155.684
+7.188
4.84%
Ranking of countries by current statistics by years