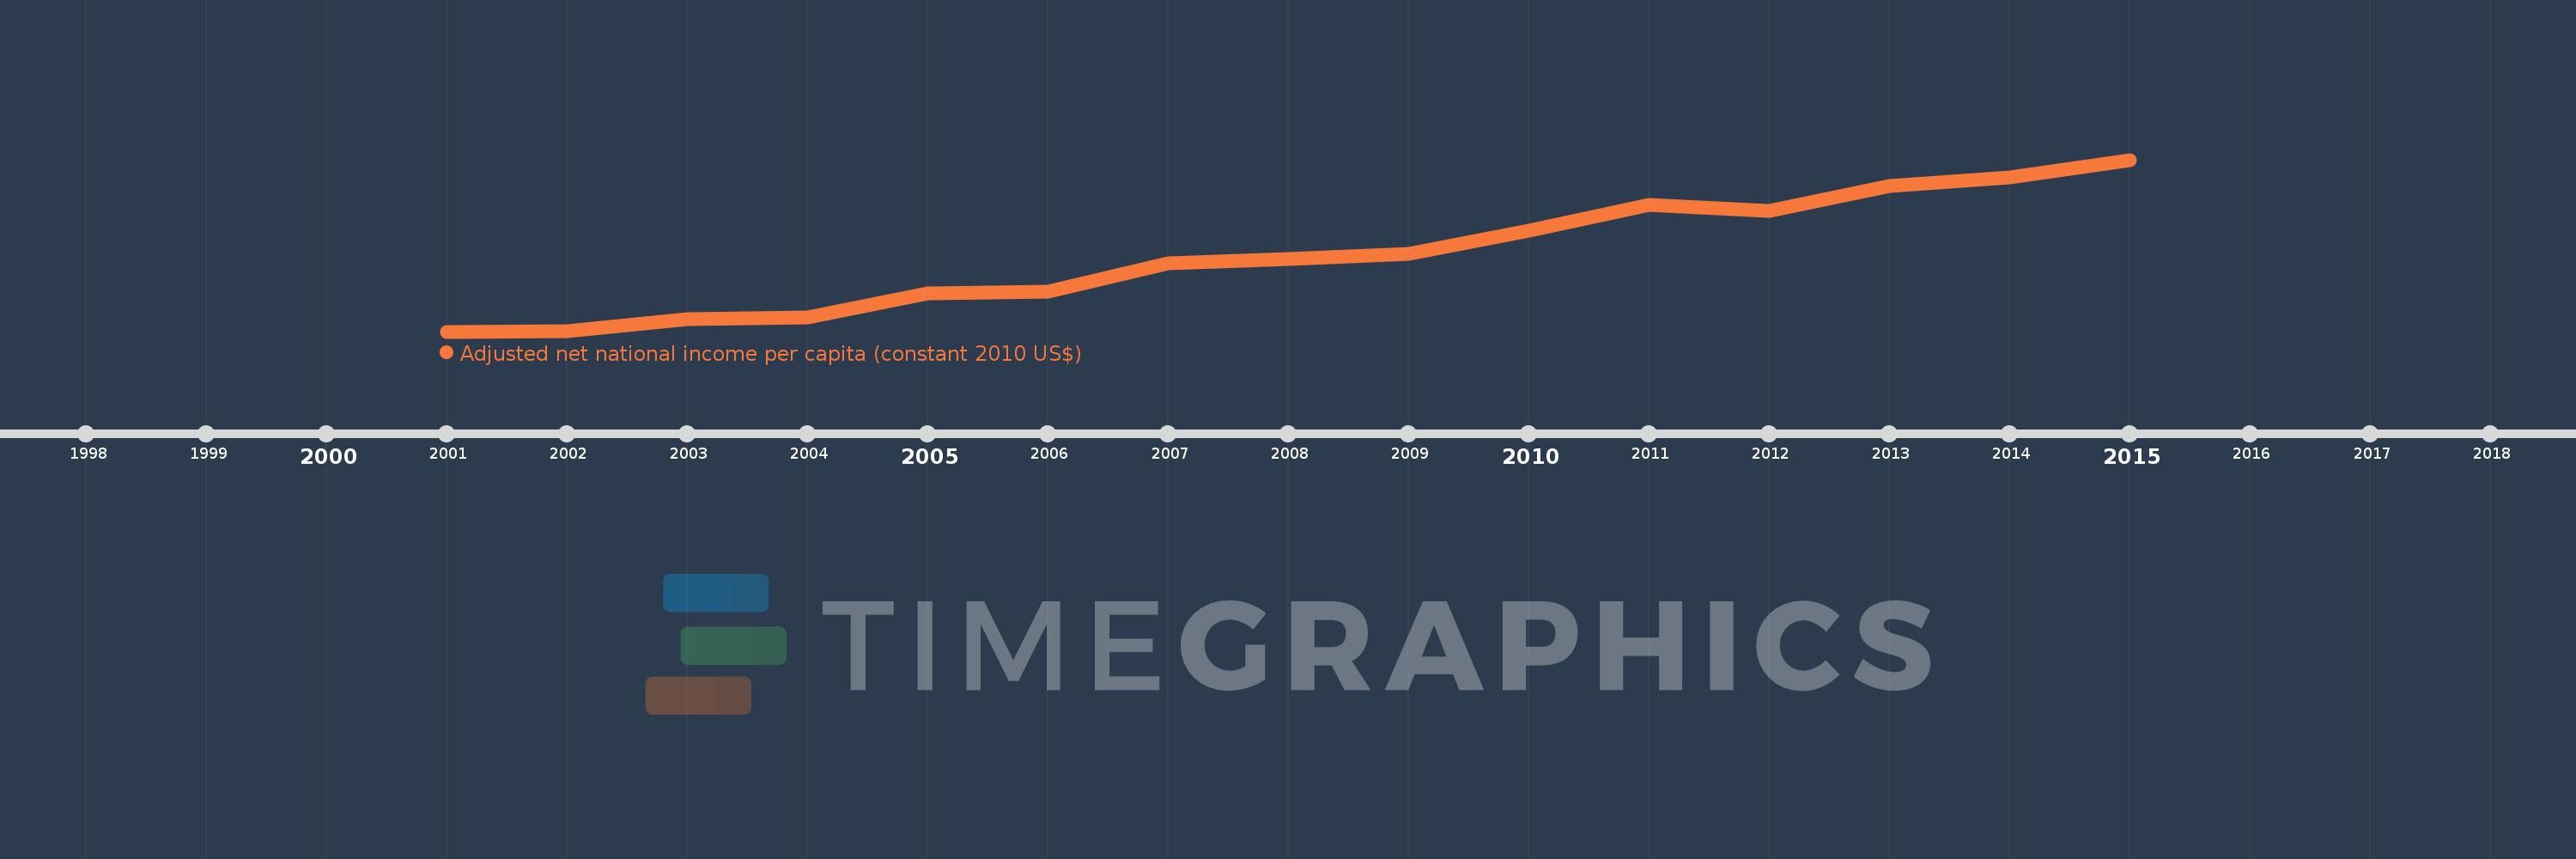
This timeline shows a graph from 2001 to 2015 of IDA blend. No data until 2000. Number of actual observations by date: 15.
Source name:
World Development Indicators
Source organization:
NULWorld Bank staff estimates based on sources and methods in World Bank's "The Changing Wealth of Nations: Measuring Sustainable Development in the New Millennium" (2011).L
Categories, topics:
Economy & Growth
Last updated:
apr 23, 2017
Indicators value changes by year
Meaning:
1.113K
Minimum:
793.305
jan 1, 2001
Maximum:
1.513K
jan 1, 2015
At the date of observation
Value
Absolute change
Change from the previous value
jan 1, 2001
793.305
+793.305
0.0%
jan 1, 2002
795.465
+2.16
0.27%
jan 1, 2003
845.953
+50.488
6.35%
jan 1, 2004
853.293
+7.34
0.87%
jan 1, 2005
954.966
+101.674
11.92%
jan 1, 2006
959.534
+4.568
0.48%
jan 1, 2007
1.08K
+120.863
12.6%
jan 1, 2008
1.099K
+18.704
1.73%
jan 1, 2009
1.117K
+18.393
1.67%
jan 1, 2010
1.215K
+97.162
8.69%
jan 1, 2011
1.324K
+108.97
8.97%
jan 1, 2012
1.299K
-24.495
-1.85%
jan 1, 2013
1.403K
+104.291
8.03%
jan 1, 2014
1.439K
+35.639
2.54%
jan 1, 2015
1.513K
+74.269
5.16%
Ranking of countries by current statistics by years